I have written many articles pointing out that there was no increase in daily or weekly fatalities in Washington state in 2020 compared to previous years. However, this is no longer true. On June 24, 2020, the CDC added 500 additional people to the death roles in Washington state without any explanation. These were not new fatalities during the month of June. Nor were they minor adjustments to the prior three weeks data – adjustments that occur every week due to late reporting from the state. Rather, these 500 additional fatalities were about 100 fatalities per week that the CDC now suddenly claims had occurred during the last week in March and four weeks in April 2020. In this article, we will try to get to the bottom of this extremely unusual change in CDC data.
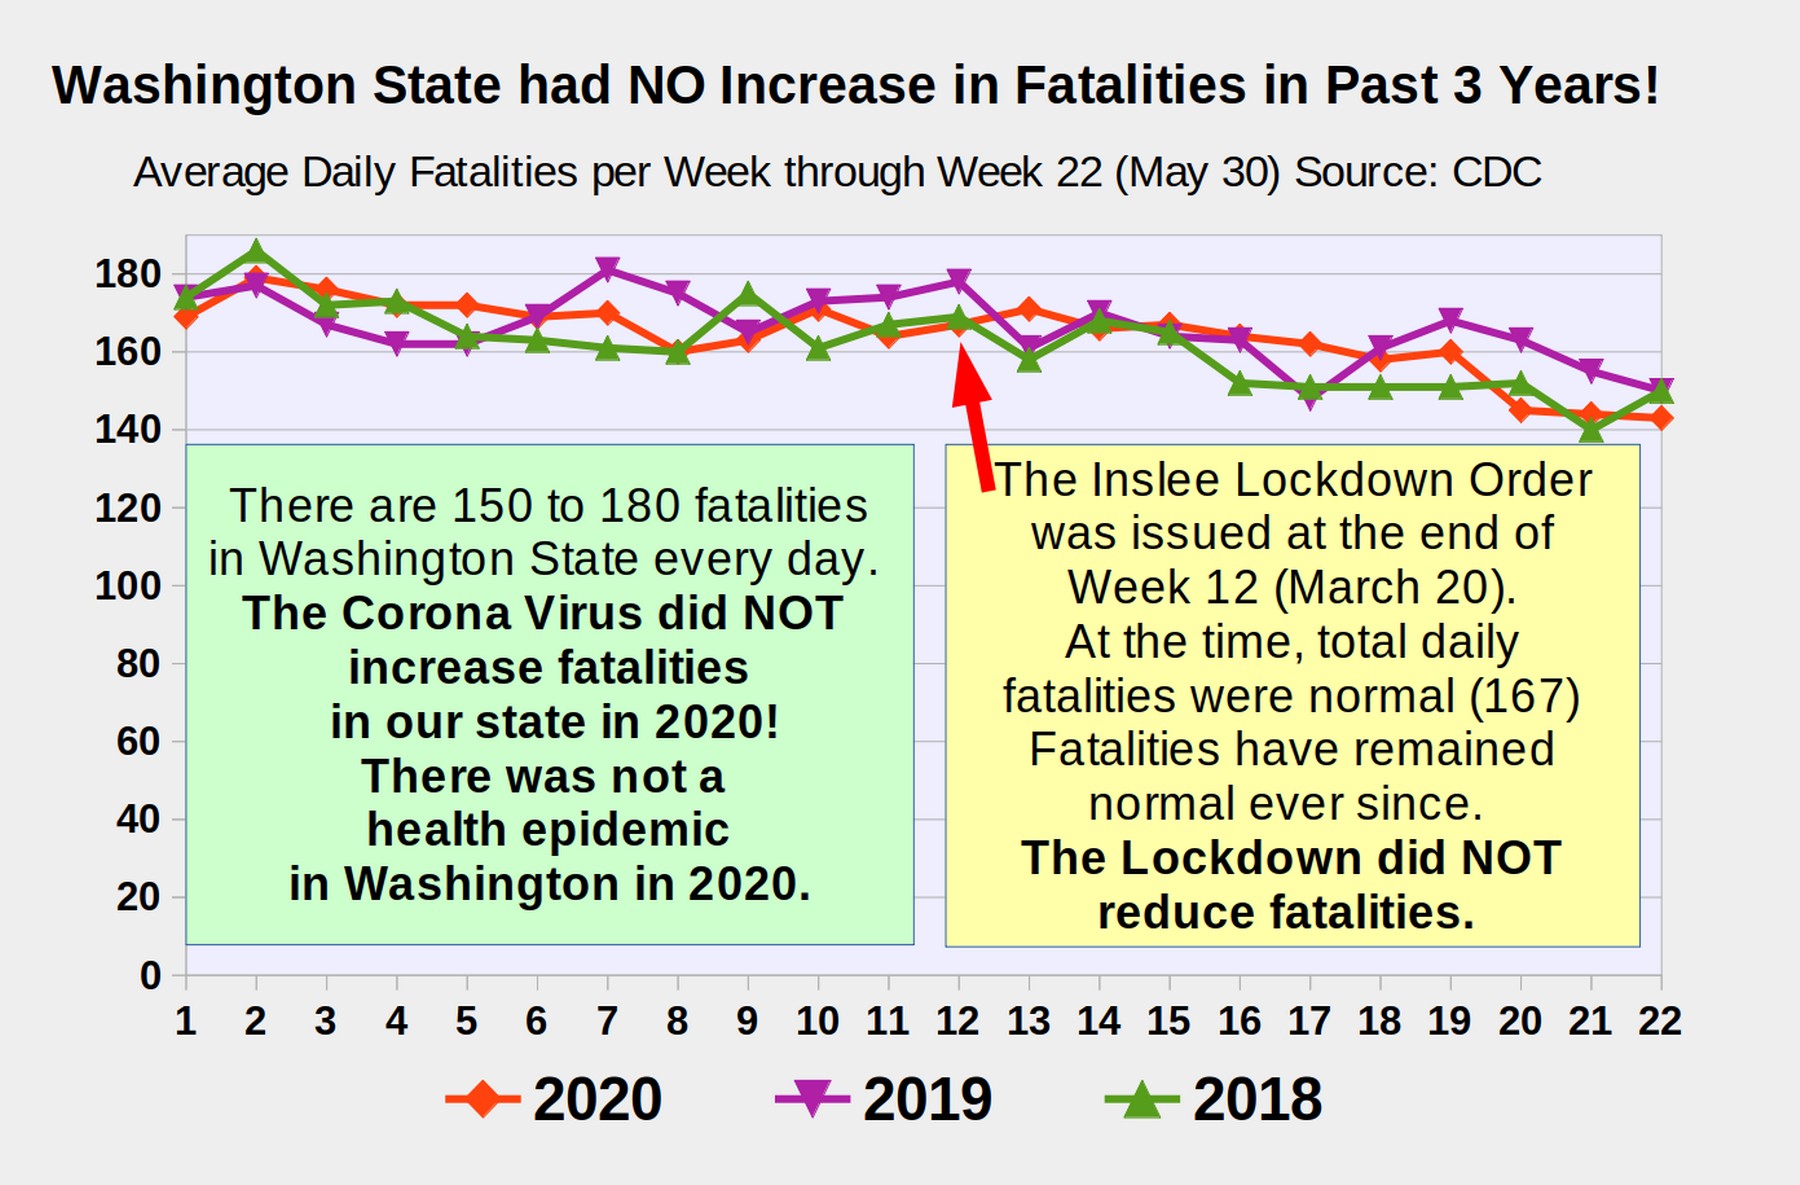
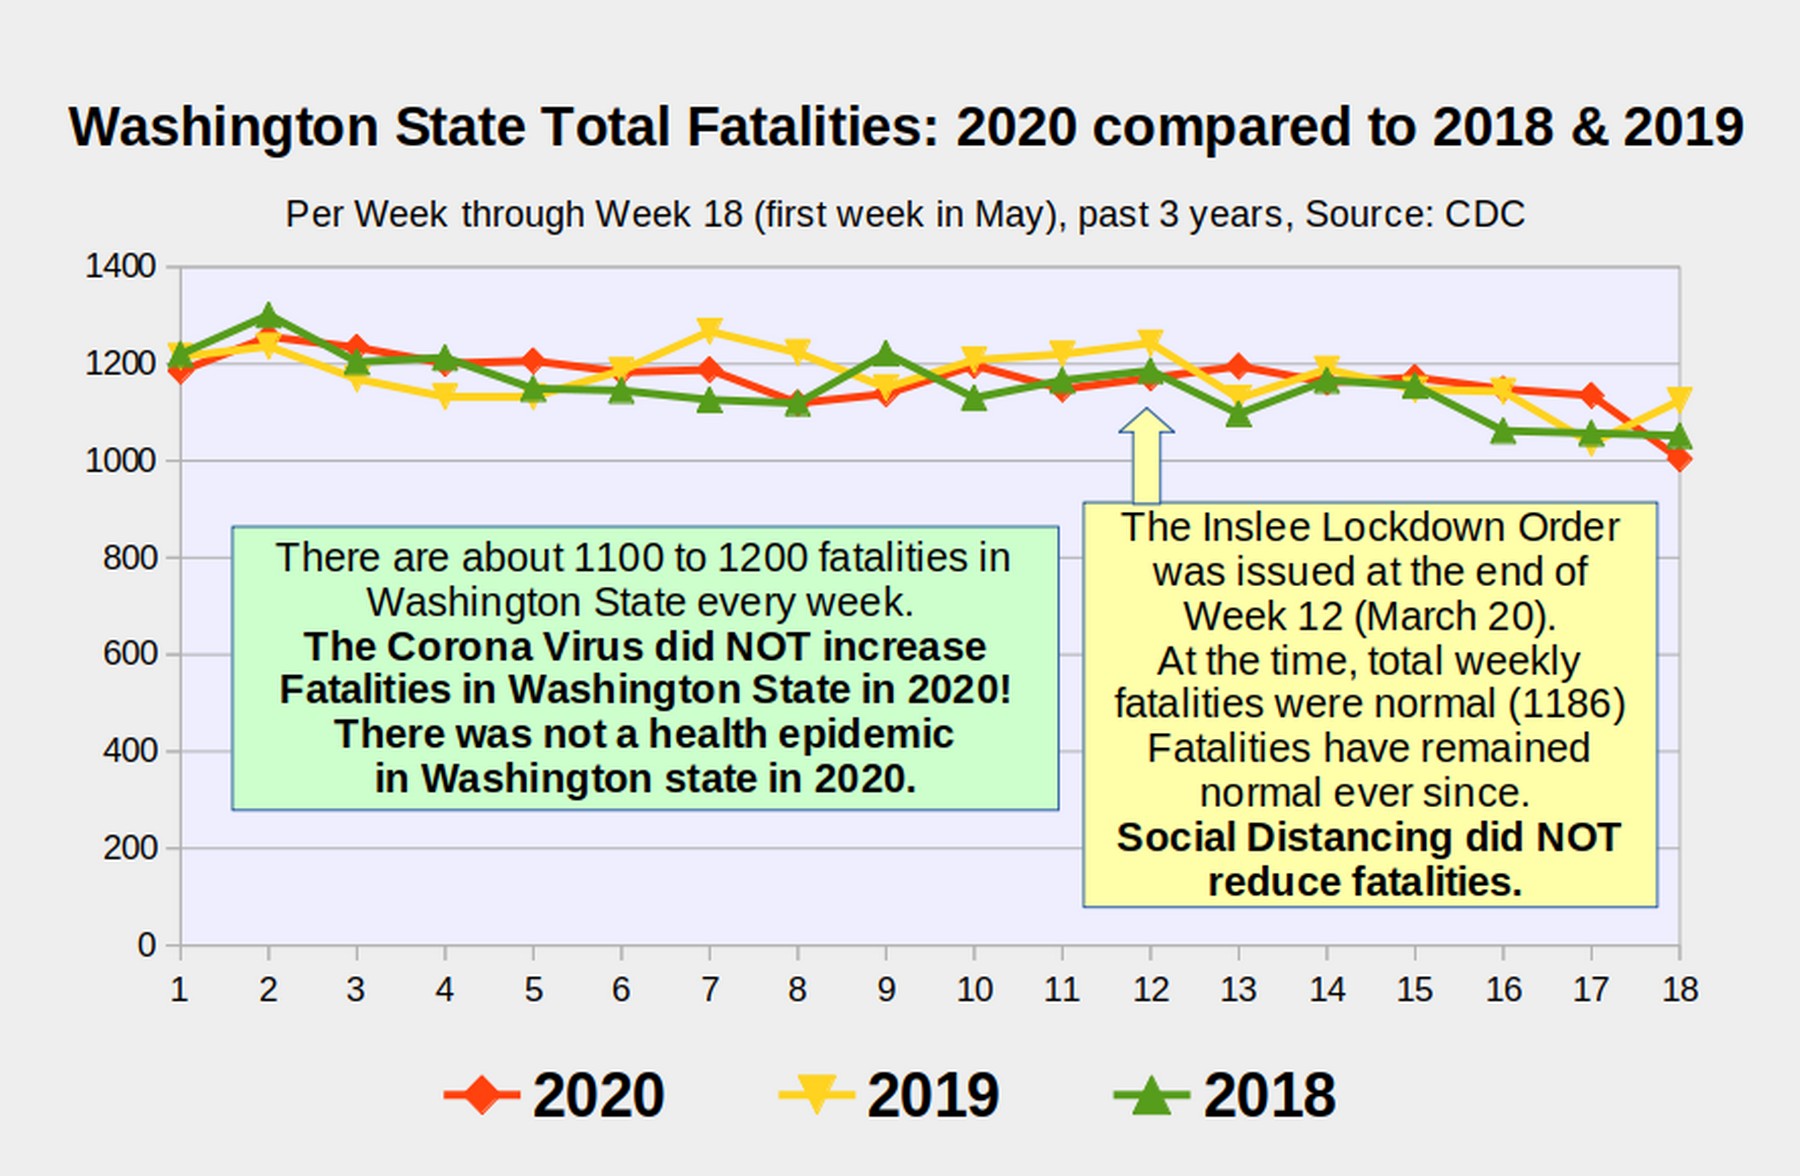
Here is a graph from an article I posted to my website and Facebook page on June 20, 2020 showing that there was no change in daily fatalities in 2020 compared to 2019 or 2018:

The above graph was based on CDC data as of June 20, 2020. To see CDC State data, go to this link:
https://www.cdc.gov/nchs/nvss/vsrr/covid19/excess_deaths.htm
Scroll down to Options and click on the link called Data.CDC. gov National and State estimates. Then click on View Data.
I have been using changes in Total Fatalities from year to year to estimate how many people have died in Washington state from the corona virus rather than Reported Corona Fatalities because – as I explain in detail in my book, Common Sense versus Corona Virus Hysteria – Reported Corona Fatalities include huge numbers of people who died from causes other than the corona virus. It even includes people who were never tested for the corona virus and died from things like gun shot wounds. You can read my book for free at the website Common Sense Book dot org.
Along with many other people, in order to determine whether there was an actual health emergency which would justify shutting down all schools and businesses in Washington state, I wanted to know how many people actually died FROM the corona virus. If you look closely at the above chart, you will see that the answer is that, as of June 20, 2020, no additional people died from the corona virus in Washington state in 2020 – and thus there was no health emergency which justified shutting down schools and businesses.