
“In the mid-19th century, Dr. William Farr made the observation that epidemic events rise and fall in a roughly symmetrical pattern that can be approximated by a bell-shaped curve.”
Farr’s Law 1840
Here is a graph using Farr’s Law made by the Center for Evidence Based Medicine estimating the corona virus normal course of progression:
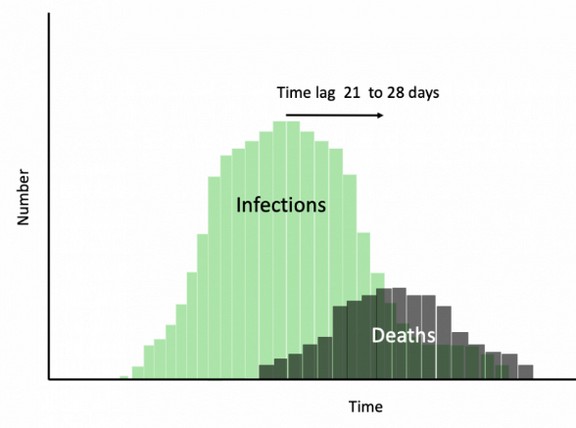
While the actual course in each country will be shaped slightly different, this graph is approximately true regardless of social isolation measures used in an attempt to change it.
In keeping with Farr’s Law, in most countries experiencing the corona virus flu, or any other flu epidemic, the number of cases rises for about a month and then hits a peak and begins declining for a month as the population gains resistance to the disease via their natural immune system. The reason I expected this to be the case is because I had studied the 2002 SARS flu epidemic and the 2012 MERS flu epidemic. Here is the pattern in South Korea in the 2015 MERS Flu epidemic:
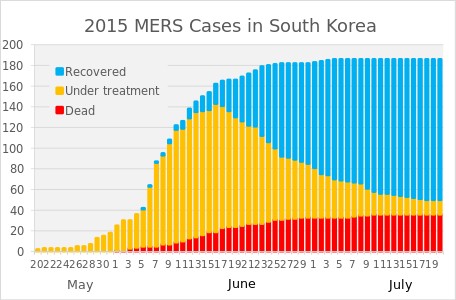
The entire flu season may be 6 months long. But in any given location, the epidemic is only two months long. In most cases, the flu epidemic infects less than 20% of the population because 80% of the population was exposed to a similar flu virus at some point in the recent past and therefore was immune to the new strain of the virus.
Therefore, when the corona virus hit Wuhan province in China I was expecting that it would rise for one month, hit a peak and begin falling for one month. Here is the graph of what actually happened in China.
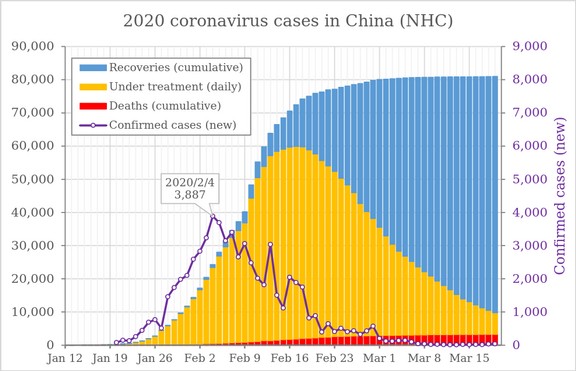
https://en.wikipedia.org/wiki/File:2020_coronavirus_patients_in_China.svg
In Wuhan, a densely populated region of about 10 million people, the daily number of confirmed cases reached a peak of 3,887 on February 4, 2020 and by March 8th had declined to 1,000 cases. The daily fatalities reached a peak 10 days later on February 14, 2020 of 143. The total number of fatalities was about 3,000. https://www.worldometers.info/coronavirus/coronavirus-death-toll/
Because of all the press coverage at the beginning of the media hysteria, back in early February, I began to look into what made the corona virus in Wuhan China more lethal than the seasonal flu.
I quickly discovered the air pollution problem was among the worst in the world. I also discovered that the fatalities were mainly in older men and that in China more than 50% of men smoked cigarettes. China has one of the highest rate of cigarette smokers in the entire world. The men in this single country consumes 30% of the world’s cigarettes. https://en.wikipedia.org/wiki/List_of_countries_by_cigarette_consumption_per_capita
Over 99% of the corona virus fatalities in China involved people with pre-existing conditions like cardiovascular disease and lung damage from all of the cigarette smoking.
It was obvious to me that the corona virus was taking advantage of damaged lungs and depressed immune systems. There were only 300 fatalities among people with normal healthy immune systems which came to only 30 people per million population. This was actually LESS than what is expected each winter from the seasonal flu. So I could not understand the media hysteria. Why weren’t they reporting the real cause of the fatalities in Wuhan?
Here is the 2020 South Korea Corona Virus Active Cases chart (again, same 30 day pattern):
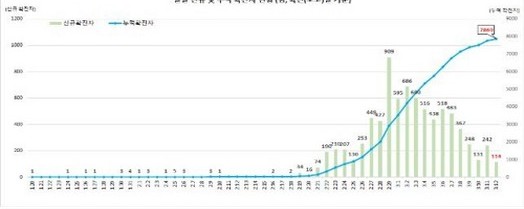
http://www.koreapost.com/news/articleView.html?idxno=20457
Note that South Korea did not engage in mandatory social isolation to the same extent as China. In South Korea, isolation was voluntary. While the time period was the same, the number of fatalities per million population was less in South Korea than in China.
South Korea had 158 deaths in a population of 51 million. This was a rate of only 3 per million. This lower death rate was in part due to the massive testing program in South Korea. But it was also likely due to less air pollution in South Korea. Beginning on March 15, 2020, South Korean Corona Virus Recoveries outnumbered new Infections for four days in a row. The steepest part of the active cases curve occurred on February 29, 2020 when 909 new cases were confirmed in a single day. The daily rate then began to fall to less than 100 new cases per day until March 15.
So in both China and Korea, we can estimate that from the beginning to the peak is just over one month followed by a one month gradual decline. Despite using two completely different containment methods, one mandatory and the other voluntary, both countries had about the same results in terms of the length of the epidemic.
South Korea did do an incredible job in offering free voluntary testing to their citizens - including about 50 drive-through testing stations across the country, where it took only 10 minutes to go through the whole procedure. Test results were available within hours.
South Korea processed up to 15,000 diagnostic tests a day, and the total number of tests reached over 220,000. The entire containment effort was voluntary. South Korea’s Vice Health Minister Kim Gang-lip told journalists: “Without harming the principle of a transparent and open society, we recommend a response system that blends voluntary public participation with creative applications of advanced technology.”
This is why I was confident as far back as February that, if there was an epidemic in the United States, it would peak about 30 days past the start of the “critical mass” date and then end about 30 days after the peak date.
This was also why I was confident that this pattern would be followed regardless of whether social isolation policies in the US were mandatory or voluntary. Not only is the time to peak similar in China and South Korea, but both of those curves are similar to the curve for the seasonal flu. Here is the seasonal flu chart in the US for the winter of 2019 to 2020:
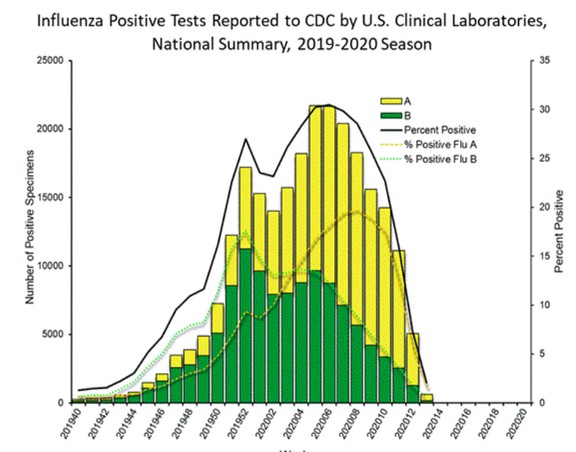
Each bar represents one week. https://www.cdc.gov/flu/weekly/index.htm#ILIMap
Type B Flu started in December, peaked at the beginning of February and was over by March. Type A flu started in January, peaked at the beginning of March and was over by April. This is what most flu epidemics look like. Here in the US, confirmed cases of the corona virus began in early March. But a critical mass of cases did not happen until about the middle of March in Washington state and New York.
This means that the peak will happen in Washington state and New York in about the middle of April. The rest of the US is about one week behind.
As of May 8, 2020, less than 2000 people per day are claimed to be dying from the corona virus in the US. We are now well past the peak of daily fatalities which means that our current 80,000 claimed deaths will turn into about 90,000 claimed deaths by May 13. Assuming that fatalities tapper off in the next 30 days, it is likely that the total number of claimed deaths in the US will be less than 120,000 by the end of May and the total number of actual deaths will be less than 60,000.
|
Start date |
Total US |
Total US Actual Fatalities |
5 day period additional claimed fatalities |
|
May 8 |
80,000 |
40,000 |
10000 |
|
May 13 |
90,000 |
45,000 |
8000 |
|
May 18 |
98,000 |
49,000 |
8000 |
|
May 23 |
106,000 |
53,000 |
6000 |
|
May 28 |
112,000 |
56,000 |
4000 |
|
May 31 |
116,000 |
58,000 |
2000 |
About 8,000 people die every day in the United States. Thus, even at the height of this epidemic, the number of corona virus victims is still a small fraction of all US fatalities.
Since March 18, the CDC has issued daily and weekly reports confirming that the number of US hospital admissions for the corona virus has been declining dramatically.
Here is the chart.
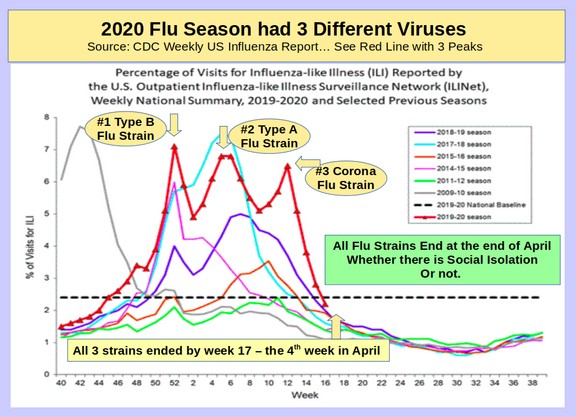
During the fourth week of April, hospital admissions for flu like illnesses fell back to the normal baseline for the past several years.
It is therefore nearly certain that in the next 30 days, fatalities in the US will also fall back to the baseline. By the end of May, there will be almost no corona virus fatalities – regardless of whether social isolation policies are maintained or abandoned.
Here is the link to the CDC weekly flu report: https://www.cdc.gov/flu/weekly/index.htm
What’s Next?
We will next look at the flaws in the Ferguson UK report. This is important because the Ferguson report was used to shut down businesses all over the world.