
This article is part of our series of articles on using real science to restore common sense to facilitate better decision making with public policies. In our book, Common Sense versus Corona Virus Hysteria, we explained that actual hospital admissions were a more accurate estimate of the rate of the corona virus than confirmed cases. This is because confirmed cases are simply related to the number of tests that are done. The more tests that are done on any given day, the more confirmed cases you will get.
In this article, we will take a closer look at how to more accurately determine actual corona virus fatalities. As we explained in our book, the reason reported corona virus fatalities is not an accurate estimate of actual corona virus fatalities is that the CDC changed the rules on March 4, 2020 to require that corona virus be listed as the cause of death even in cases where it had nothing to do with the cause of death. Hospitals were even paid thousands of extra dollars if they listed the corona virus as a cause of death. These two incentives led to an explosion of claimed or reported corona virus fatalities after March 4th.
We obviously need to find a better way to determine actual corona virus fatalities. In this article, we will estimate actual corona virus fatalities by comparing the total number of people killed each week in 2020 to the total number of people killed each week in 2019 in Washington state.
As of May 20th, the Washington state Department of Health claimed that more than 1000 people have been killed from the corona virus in our state. But the Department of Health also said that because corona virus deaths may have occurred as early as January 1, as many as 3000 people may have been killed by the corona virus. If this is true, then there should be some increases in total fatalities as far back as January. So we will look closely at every week since January 1, 2020. If you live in a different state, the following CDC page links to a table where you can see the week by week fatalities in your own state. To see CDC State data, go to this link: https://www.cdc.gov/nchs/nvss/vsrr/covid19/excess_deaths.htm
Scroll down to options and click on the link called Data.CDC. gov National and State estimates. Then click on View Data. Then click on State, Sort Descending. Then click Next about 20 times to get to Washington State.
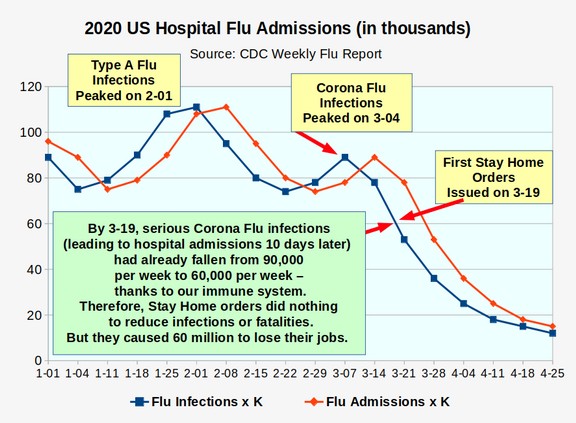
To give us some context of how the current corona virus flu season compares with past flu seasons, let’s begin by looking at a CDC graph comparing this years flu season to the past several years of flu seasons in terms of hospital admissions.
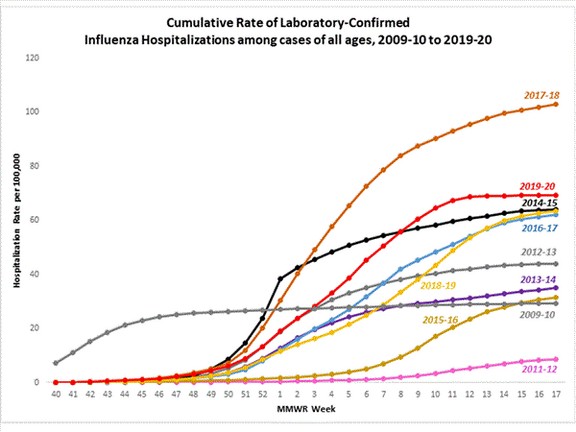
This graph shows that this years flu-related hospitalizations (the red line) were actually LESS than 2018 flu related hospital admissions (the brown line). The graph makes it pretty obvious that the 2018 Seasonal Flu was much worse than the total of all flu versions – including corona virus flu – in 2020. But 2020 was slightly worse than 2019 (the yellow line). You can see that the 2019 flu season was an average flu season.
It is also obvious that all flu seasons end at about week 17 -which is the beginning of May – when the sun finally comes out. So why is Washington state still in lockdown?
The claim is that more people died who went to the hospital with the corona virus that who died in going to the hospital with the seasonal flu. To see if this is true, we need to look at actual fatalities from week to week. Here is a table made from the CDC State Fatalties database. We will begin by looking closely at the first two months of 2020 compared to 2019.
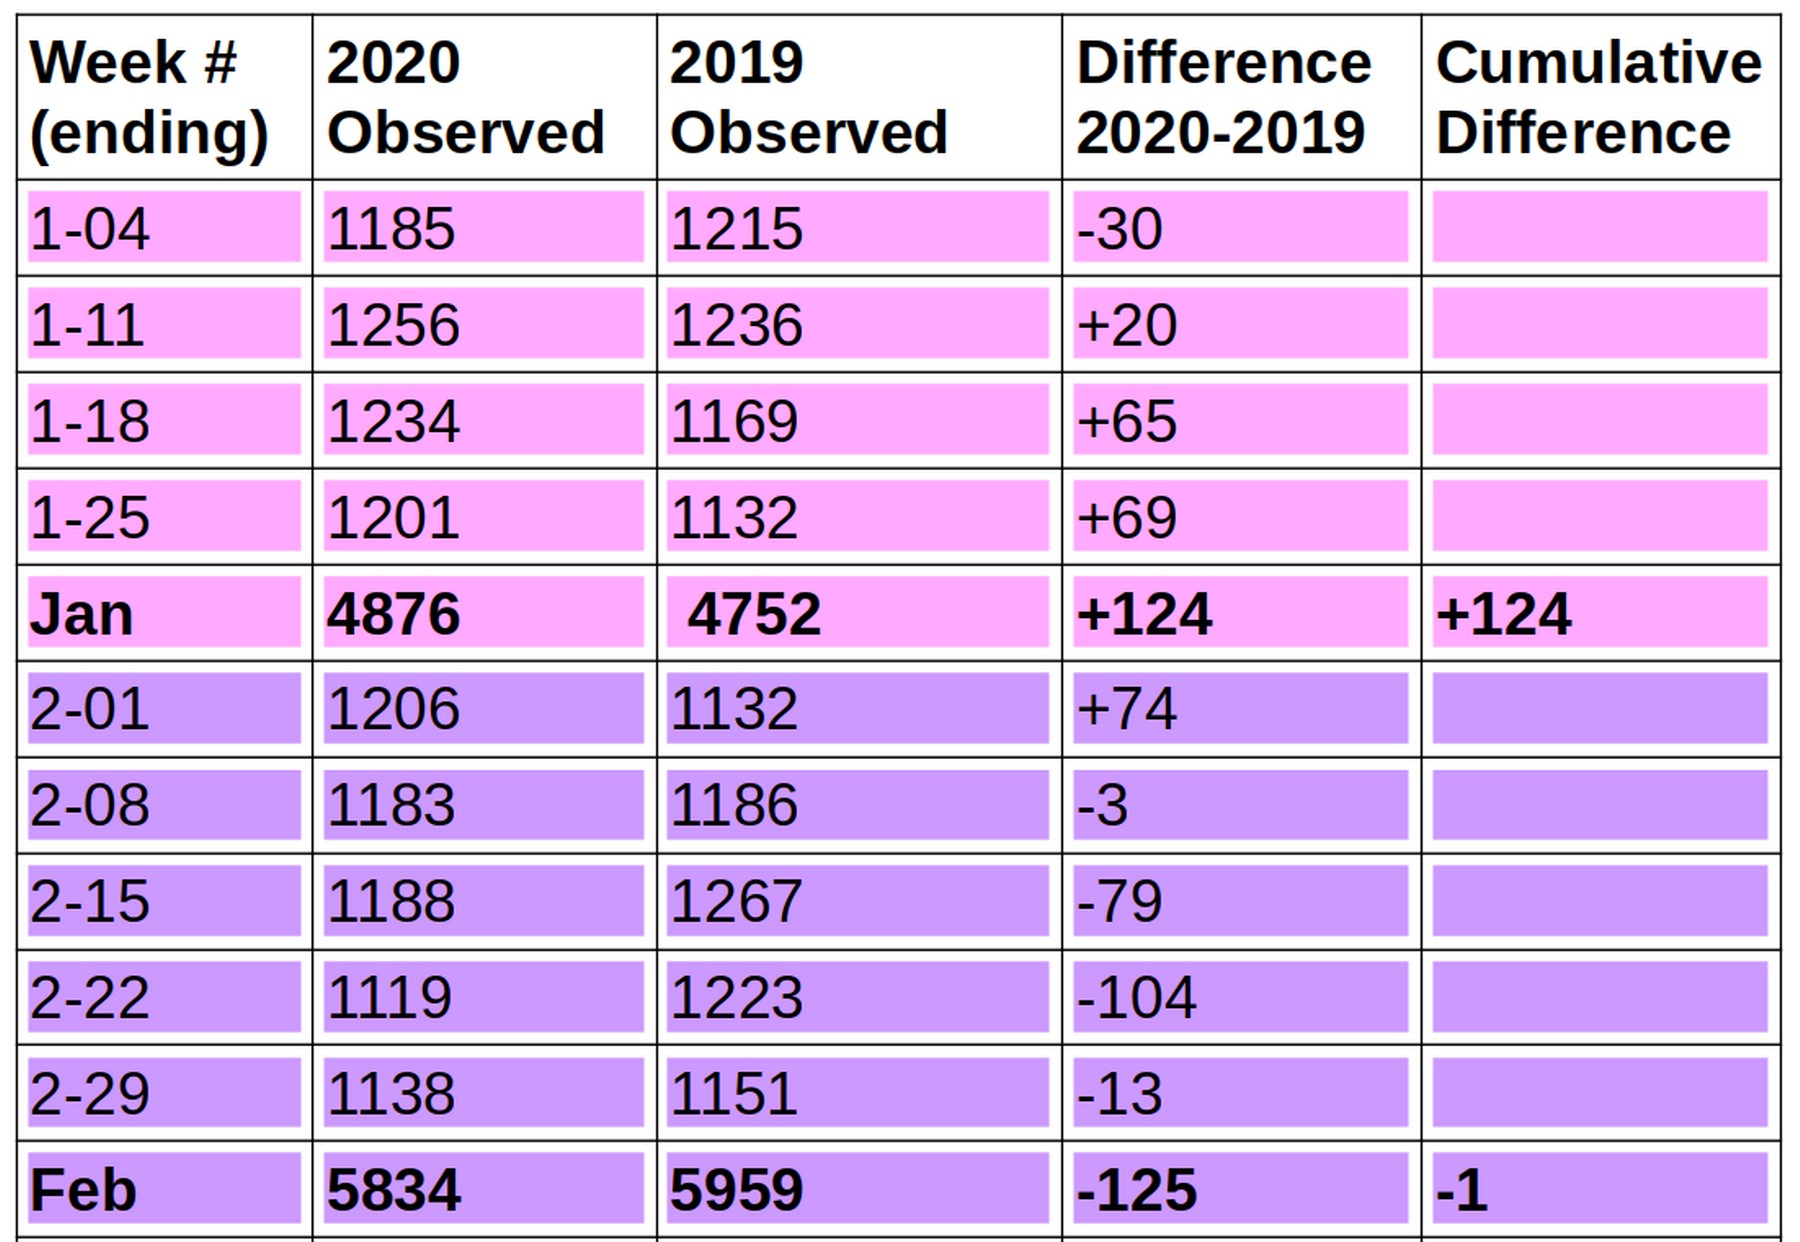
The first row on this table is all fatalities that occurred in Washington state during the first week of Janaury which ended on Friday, January 4th. It shows that 1,185 people died on the first week of 2020. This was 30 less than 1,215 people who died during the first week of 2019. The next three weeks, many more people died in 2020 than died in 2019. If all we looked at was these three weeks, we might incorrectly assume these were corona virus fatalities.
But then look closely at the month of February. Suddenly these fatalities drop off in 2020 compared to 2019. by the end of February, there is literally no difference in fatalities between 2020 and 2019.
January 2020 had 124 more fatalities than 2019. But February 2020 had 125 fewer fatalities than 2019. This is strong evidence that the Washington state Department of Health claim that thousands of people died from the corona virus in January and February is not supported by the facts. Now let’s look closely at what happened in February and March of 2020 compared to the same two months in 2019.
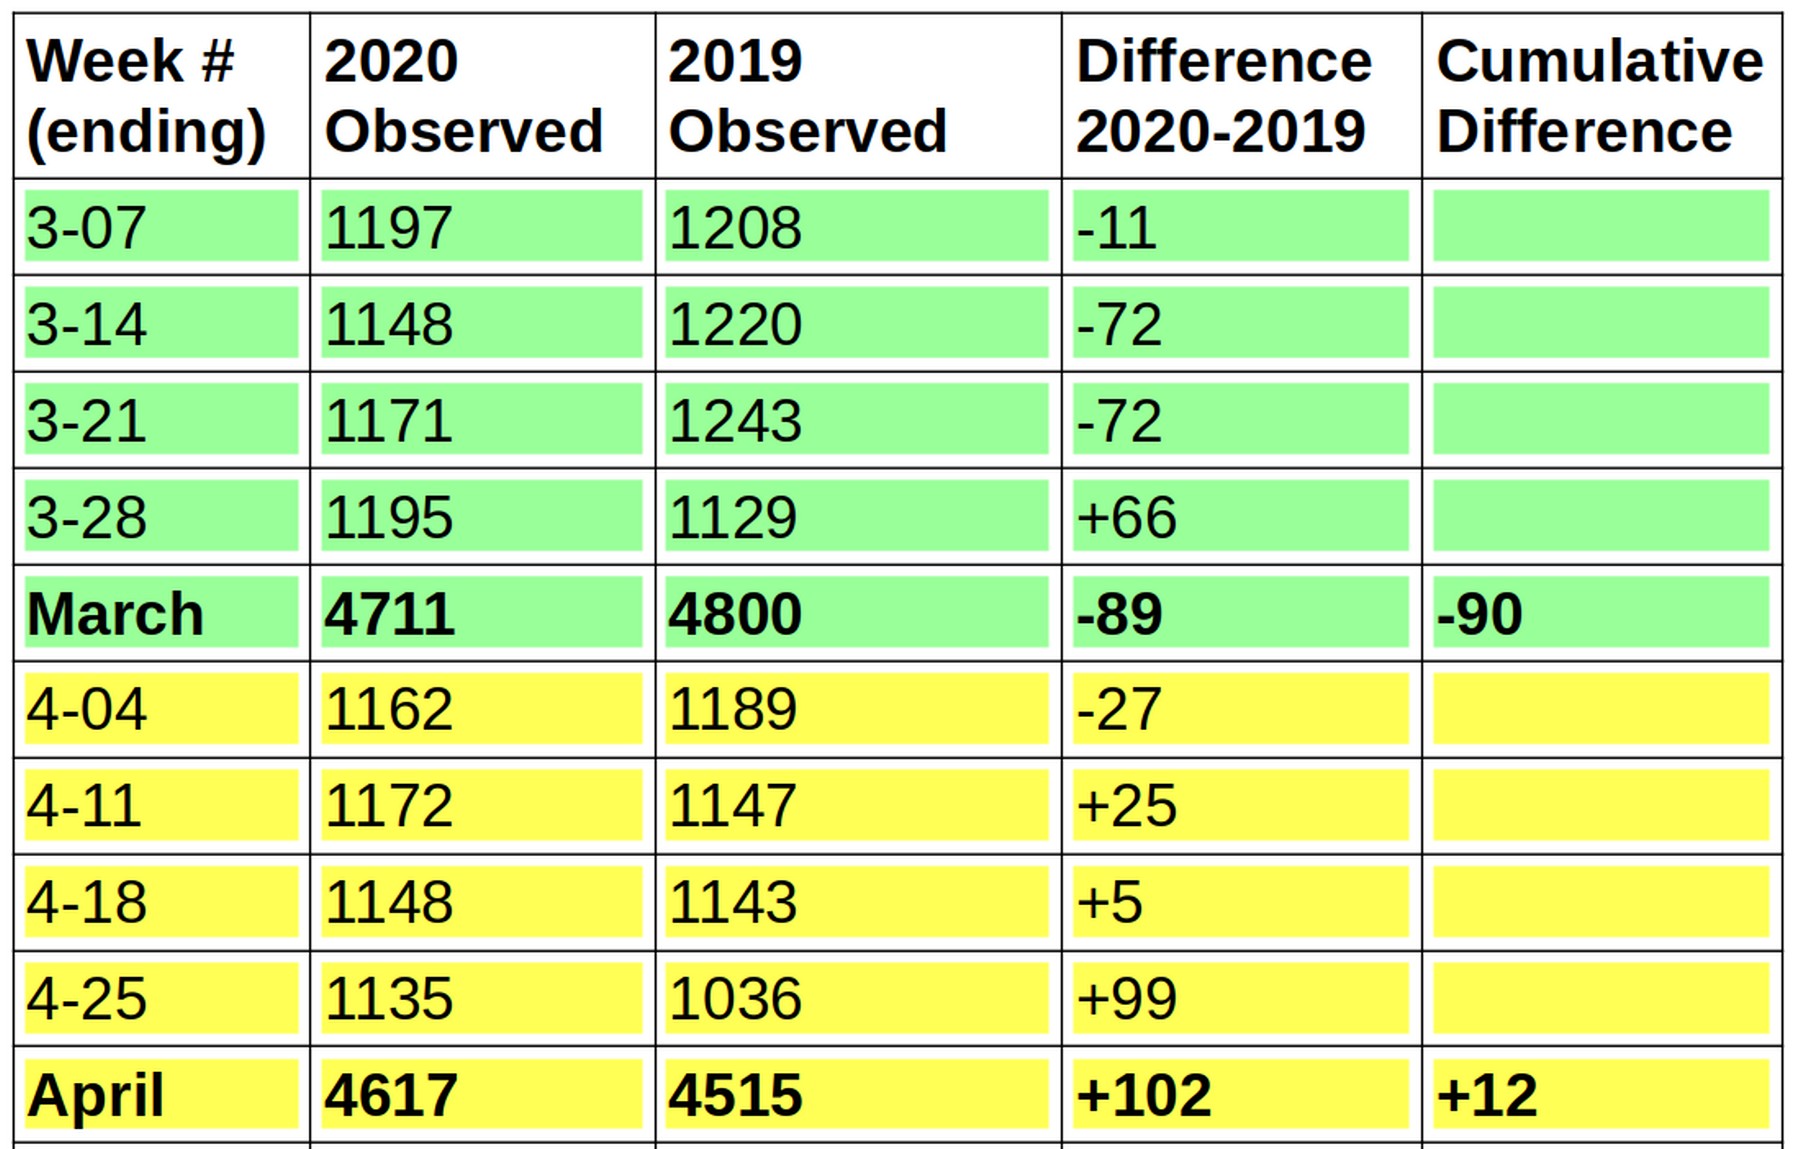
There were 89 fewer fatalities in March 2020 than in March 2019.
Then there were 102 more fatalities in April 2020 than there were in April 2019. What we are seeing here is the normal variation in flu fatalities from one year to the next and one month to the next.
By the end of April, there was no significant change in fatalities in Washington state from 2019 to 2020. In total, only 12 more people died in 2020 by the end of April than died in 2019 by the end of April.
Why this is important is that the legal definition of an epidemic is a period of time in which a disease causes a “significant increase in infections or fatalities above the historical average.”
At no point in 2020 were fatalities in Washington state “significantly above 2019 fatalities” or “significantly above the average of the past several years. Therefore, there was no corona virus epidemic in Washington state in 2020. Therefore, there never was a health emergency in Washington state and Inslee’s shutdown orders were based on claims that were factually incorrect. I realize people will get mad at me for saying this. But the facts are the facts and I believe public policies should be based on actual facts and not on fake computer models paid for by billionaires who are simply trying to scare people.
On March 20, 2020 when Inslee shut down all schools and businesses, there was no actual increase in either hospital admissions or fatalities. In fact, actual corona virus infections had already fallen by mire than 50%.
Even on May 1, 2020, when Inslee extended the shutdown into June, there was no huge number of hospital admissions or fatalities. In fact, hospital admissions had fallen to less than 1% of capacity (causing many hospitals to lay off staff) and total fatalities were almost exactly the same as the previous year.
So now let’s look at what has happened so far in the first three weeks of May 2020.
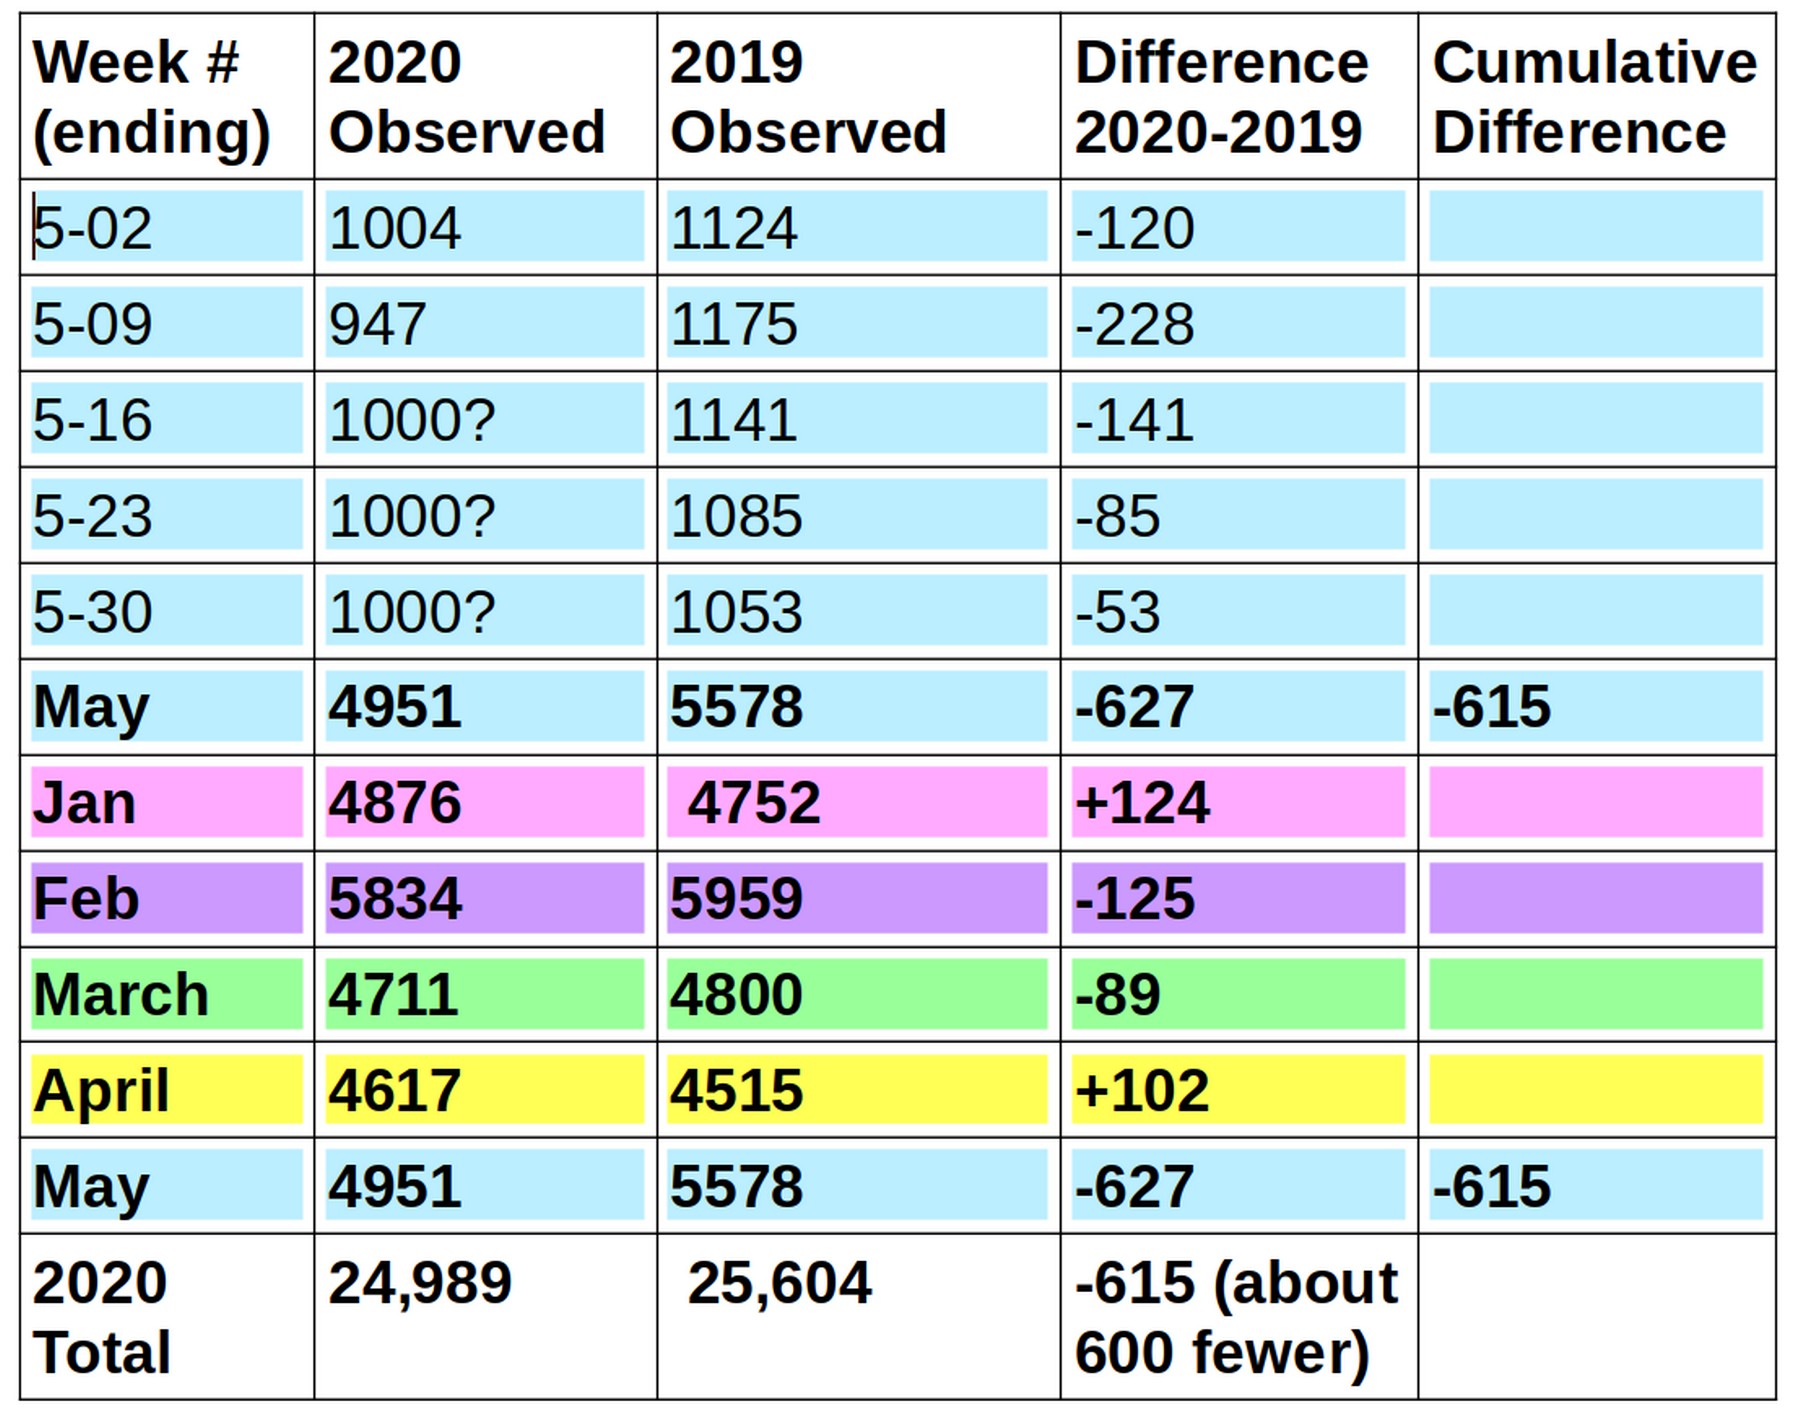
I have had to make some projections for the final weeks of 2020 since the actual numbers have not been reported to the CDC yet. But it is clear that fatalities are much less in May 2020 than they were in May 2019.
Comparing the Actual Number of Fatalities in 2020 to the Ferguson Estimate of Fatalties
Governor Inslee closed all schools and nearly all businesses in Washington state on March 20, 2020 because he naively believed a fake computer model constructed by a fake scientist called Neil Ferguson whose college had been paid over $100 million by Bill Gates to create these fake models. On March 16, 2020, Ferguson published his fake model predicting that US hospitals would be overwhelmed with Corona victims by May 20, 2020 and that fatalities in the US would reach 2.2 million by June 20, 2020. Since Washington state is about 1/50 of the US population, the Ferguson model predicted that 44,000 people would die in Washington state from the corona virus by June 20, 2020. Clearly, this has not been the case. Yet Inslee continues to believe and even site unreliable computer models paid for by Bill Gates as the reason why he is keeping our state’s economy locked down.
Why a Reduction in Traffic Fatalities Does Not Explain the Drop in Total Fatalities in 2020
When I posted this information on Facebook this week, some people who did not look at the full table of data claimed that the reason there were less fatalities in 2020 than 2019 was because there were fewer traffic accidents in 2020 due to the lockdown.
But look closely at the table. The two months of the shutdown were April and May. One could claim for the sake of argument that during April, there were 1000 people killed by the corona virus which was offset by 1000 people not being killed by car accidents.
However, this argument is clearly refuted by the data for May. The shutdown was still in effect in May. Car usage did increase a little bit. But total fatalities fell dramatically in May 2020 compared to May 2019. Had car fatalities been a factor, we would have expected the trend from the previous month to continue. Instead, just the opposite happened.
Also look at January and February and March when there was no shutdown yet and car accidents must have been “normal.” The numbers go up and down completely independent of whether there was a shutdown or not a shutdown.
The Above Table Confirms the Null Hypothesis: There is No Relationship between Lockdowns and Fatalities
This is a perfect example of the fact that there is simply no relationship between the shutdown and total fatalities. Put in plain English, it is about the same result as if we had created the table by throwing darts at a dart board. In science, these are called “random results” which is another word for “no relationship” which is another way of saying that we just confirmed the Null Hypothesis which means that we assume there is no relationship until a relationship is proven. In this case, since no relationship was proven, there is no relationship.
So how do we account for the fact that the Washington State Department of Health claims there have 1,000 to 3000 fatalities in our state “related to the corona virus”? One would think we would have 1,000 to 3000 more total fatalities than previous years – not 600 less.
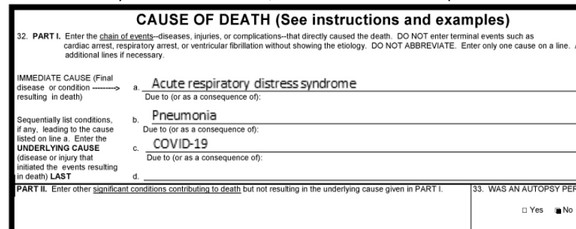
The answer (as I explain in detail in the first chapter of my book) is that on March 4, 2020, the CDC changed the rules and required that the corona virus be listed as a cause of death in any cases where it might be related to the death – regardless of whether there was a positive test! This change caused a huge drop in seasonal flu deaths at the same time there was a huge increase in corona virus deaths. The table above makes it clear that deaths that otherwise would have been attributed to seasonal flu in past years were instead listed as “related to corona virus.” It is now a fact. There never was any mass death in Washington state in 2020 due to the corona virus. The claim that huge numbers of people died from the corona virus (more than average) is simply not supported by the actual evidence.
More Proof that Social Distancing Had No Effect on Corona Virus Infections or Fatalities
For those still clinging to the belief that social distancing was needed to stop the corona virus, here is a chart of hospital admissions. Note that by the time Inslee first ordered the state shutdown on March 20th, corona virus infections had already fallen by 50%.
The same CDC webpage confirms that flu related hospital admissions are now less than 1 percent of all hospital admissions.
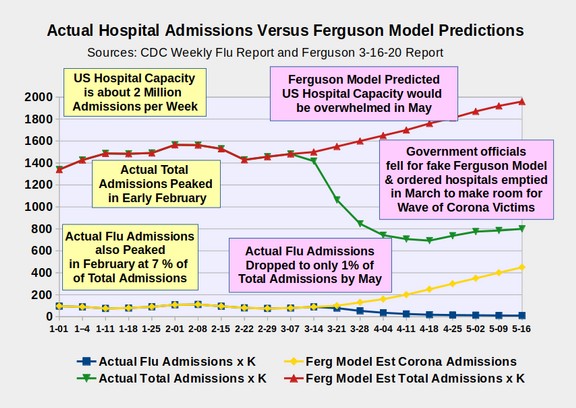
The highest rate of hospitalizations and fatalities ever recorded in the US was 10 percent during the 2018 flu season. The highest the corona virus ever reached in 2020 was 7 percent at the middle of March 2020. Ferguson’s model predicted it would reach 30% in May. This estimate was three times the highest precentage ever recorded. In fact, corona admissions were down to one percent of total admissions by May.
Why did Ferguson over-estimate corona virus hospital admissions by a factor of 30?
One possible answer is that the only way for corona virus infections to exceed the admission capacity of US hospitals (2 million admissions per week) would be to over-estimate corona virus admissions by a factor of 30. It appears that the entire purpose of the Ferguson model was to construct a set of data which was deliberately intended to exceed the US hospital capacity. If this were the goal, it would also explain the need to extend fatalities into the month of June (another event which has never happened in US history) which in turn led to the now widely ridiculed estimate that 2.2 million people would die in the US from the corona virus by June 20, 2020.
Research that Closing our Schools was also not needed

More than 70 studies from around the world have confirmed that there is not a single recorded case anywhere in the world of a child transmitting the corona virus to any adult. Thus, there was never any need to shut down our schools or businesses in the first place.
https://dontforgetthebubbles.com/wp-content/uploads/2020/04/COVID-data-top-10.pdf
Washington now has nearly 20,000 confirmed infections. Because many studies put actual infections at 50 times confirmed infections, this means that Washington state now has nearly one million people who have the corona virus.
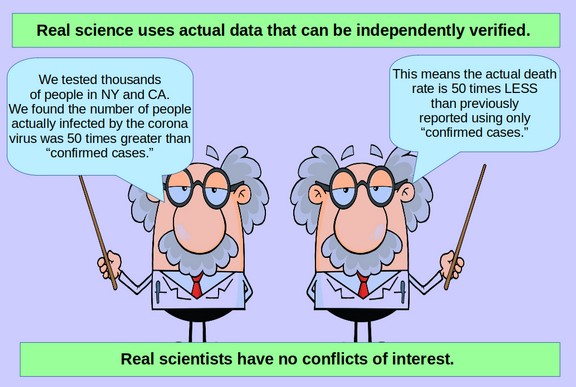
This means that no amount of testing, contact tracing, lockdowns or mask wearing will stop the virus from spreading throughout the population. The good news is that this also means that the fatality rate from the corona virus is about the same as the seasonal flu.

Far from saving the lives of those we love, at least ten people will be killed from Governor Inslee Shutting down our businesses for every person claimed to have been killed by the corona virus.

More specifically, as of May 21, 2020, more than one million people have lost their jobs in our state versus just over one thousand people claimed to have been killed by the corona virus. I have posted a mountain of research in my book and website showing that when one million people lose their jobs, the death rate among those one million unemployed people goes up by about one percent during the succeeding year. This is an additional 10,000 fatalities in our state due to Inslee shutting down our economy. These hidden fatalities will be from increases in suicide, drug abuse, alcoholism, homelessness, loss of health care and other problems which affect those who fall into poverty in the coming months.
For Governor Inslee to continue forcing our state’s businesses to remain closed in spite of these facts is a travesty against every small business owner and every unemployed person in our state. People do not need a check from the government. What they need are meaningful jobs.

Proof that Corona Virus Fatalities are Continuing to Fall
In the book I published on May 8, based on the sharp decline in corona virus hospital admissions at the end of April, I predicted there would be a sharp drop in corona virus fatalities by the end of May. All the Gates funded fake scientists predicted just the opposite – that fatalities would go up by the end of May because several states ended their lockdowns. That end-of-May deadline is only 8 days away. Here is the latest as of May 22, 2020:
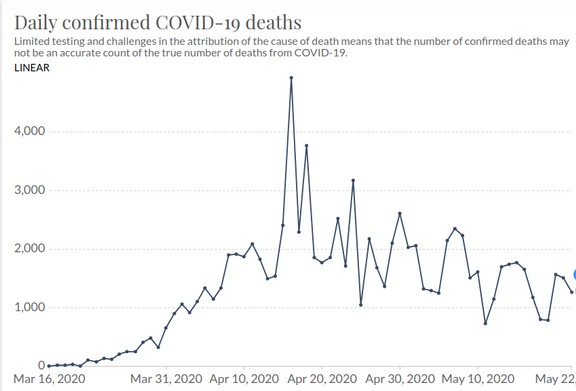
On May 8, 2020, US fatalities were about 2000 per day. Since then, US fatalities have fallen to about 1500 per day. The jury is still out as to what the number will be at the end of May. But so far, it looks like I will be proven right and the Gates funded hacks will be proven wrong.
How about fatalities in Washington state?
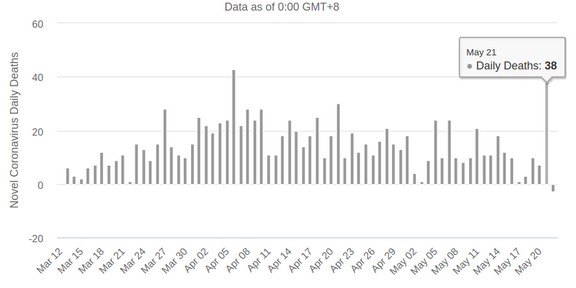
This is from World O meter. It shows that on May 21, 2020, there 38 newly “reclassified corona fatalities in Washington state.
But the daily average in Washington state was about 15 per day on May 8, 2020. The last five days have been 1, 3, 10, 7 and minus 3 for an average of 3. Clearly the data is not yet complete. It will be interesting to see if the numbers get close to zero by the end of May. We do not have long to wait.
What Happened in the States that Re-opened?
I predicted that fatalities would go down in states that re-open as going outside is good for improving their immune systems. There have been articles claiming that states that opened up early actually had a reduction in infections and fatalities. Here is a quote and a link from a JP Morgan report: “Infection rates declined, not increased, after lockdowns ended.” https://www.zerohedge.com/markets/jpms-kolanovic-finds-coronavirus-lockdowns-may-have-caused-more-deaths-covid-19-itself
However, it was reported that Texas had 1000 new cases three days in a row. As I have said many times, new cases are simply related to the number of people tested. They have nothing to do with any increase or decrease in risk. What is slightly more accurate is reported fatalities.
Here is a map of the states that have opened versus the states that remained closed.
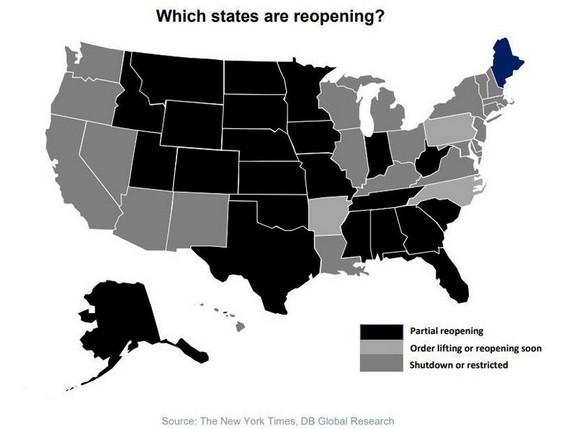
Here is the latest on Texas reported fatalities: Texas is now at 49 fatalities per million population. This places Texas as much safer than Washington state which is at 136 fatalities per million. So the idea that Texas is awash in dead bodies is ridiculous.
What will be happening is that about 10,000 needless additional deaths will occur here in Washington state in the coming months due to one million people losing their jobs. Meanwhile in states that opened on May 1, there will be some increases in fatalities from job losses. But the rate will not be as high as here in Washington state where there is still a widespread lockdown and ever increasing job losses.
Numerous Studies Have Now Concluded that there is no relationship between Lockdown Policies and Saving Lives
On May 19, 2020, a summary of the latest research was published on the question of whether lockdown policies have saved even a single life. The answer has consistently been no relationship between lives lost and lockdown policies. Here is a link to this report:
https://www.aier.org/article/did-the-lockdown-save-lives/
These studies that countradict the lockdown narrative include the New York study which found that nearly all corona hospital admissions were people who had been locked down in their homes.
There was also an interesting study by TJ Rodgers who compared the lockdown policies in all 50 states to the fatality rate per million in each state. The result was that there was no relationship at all between lockdown policies and fatalities.
Then there was the study done by an Dr. Ben-Israel of Tel Aviv University. Here is his quote which I have also noted in my book:
“Simple statistical analysis demonstrates that the spread of COVID-19 peaks after about 40 days and declines to almost zero after 70 days — no matter where it strikes, and no matter what measures governments impose to try to thwart it.”
His analysis was done more than one month ago and remains as valid today as it was back then.
Finally, we have a more recent study from Bloomberg News that carefully charted lockdown policies and deaths in several nations. Here is the link: https://www.bloomberg.com/graphics/2020-opinion-coronavirus-europe-lockdown-excess-deaths-recession/
Here was their conclusion: “There’s little correlation between the severity of a nation’s restrictions and whether it managed to curb excess fatalities — a measure that looks at the overall number of deaths compared with normal trends.”
In fact, there was no relationship at all between lockdown policies and fatalities. So when are we going to demand an end to these draconian lockdown policies that have already harmed millions of people?
More evidence is coming in every day that lockdowns do more harm than good. The only question now is how much more evidence will people need before they finally wake up and stop believing these fake computer models and instead look at actual hospital admissions and actual total fatalities (which are the only two numbers that cannot be manipulated)?
I hope this article has helped you better understand the need to look at real data rather than fake made up models. As always, our goal is to use real science to restore common sense to policy making decisions in the US.
Please subscribe to our email list. Then share this article with anyone you know who cares about the truth.
As always, I look forward to your questions and comments.
Regards,
David Spring M. Ed.
springforschools at gmail dot com