
I have written many articles pointing out that there was no increase in daily or weekly fatalities in Washington state in 2020 compared to previous years. However, this is no longer true. On June 24, 2020, the CDC added 500 additional people to the death roles in Washington state without any explanation. These were not new fatalities during the month of June. Nor were they minor adjustments to the prior three weeks data – adjustments that occur every week due to late reporting from the state. Rather, these 500 additional fatalities were about 100 fatalities per week that the CDC now suddenly claims had occurred during the last week in March and four weeks in April 2020. In this article, we will try to get to the bottom of this extremely unusual change in CDC data.
Here is a graph from an article I posted to my website and Facebook page on June 20, 2020 showing that there was no change in daily fatalities in 2020 compared to 2019 or 2018:
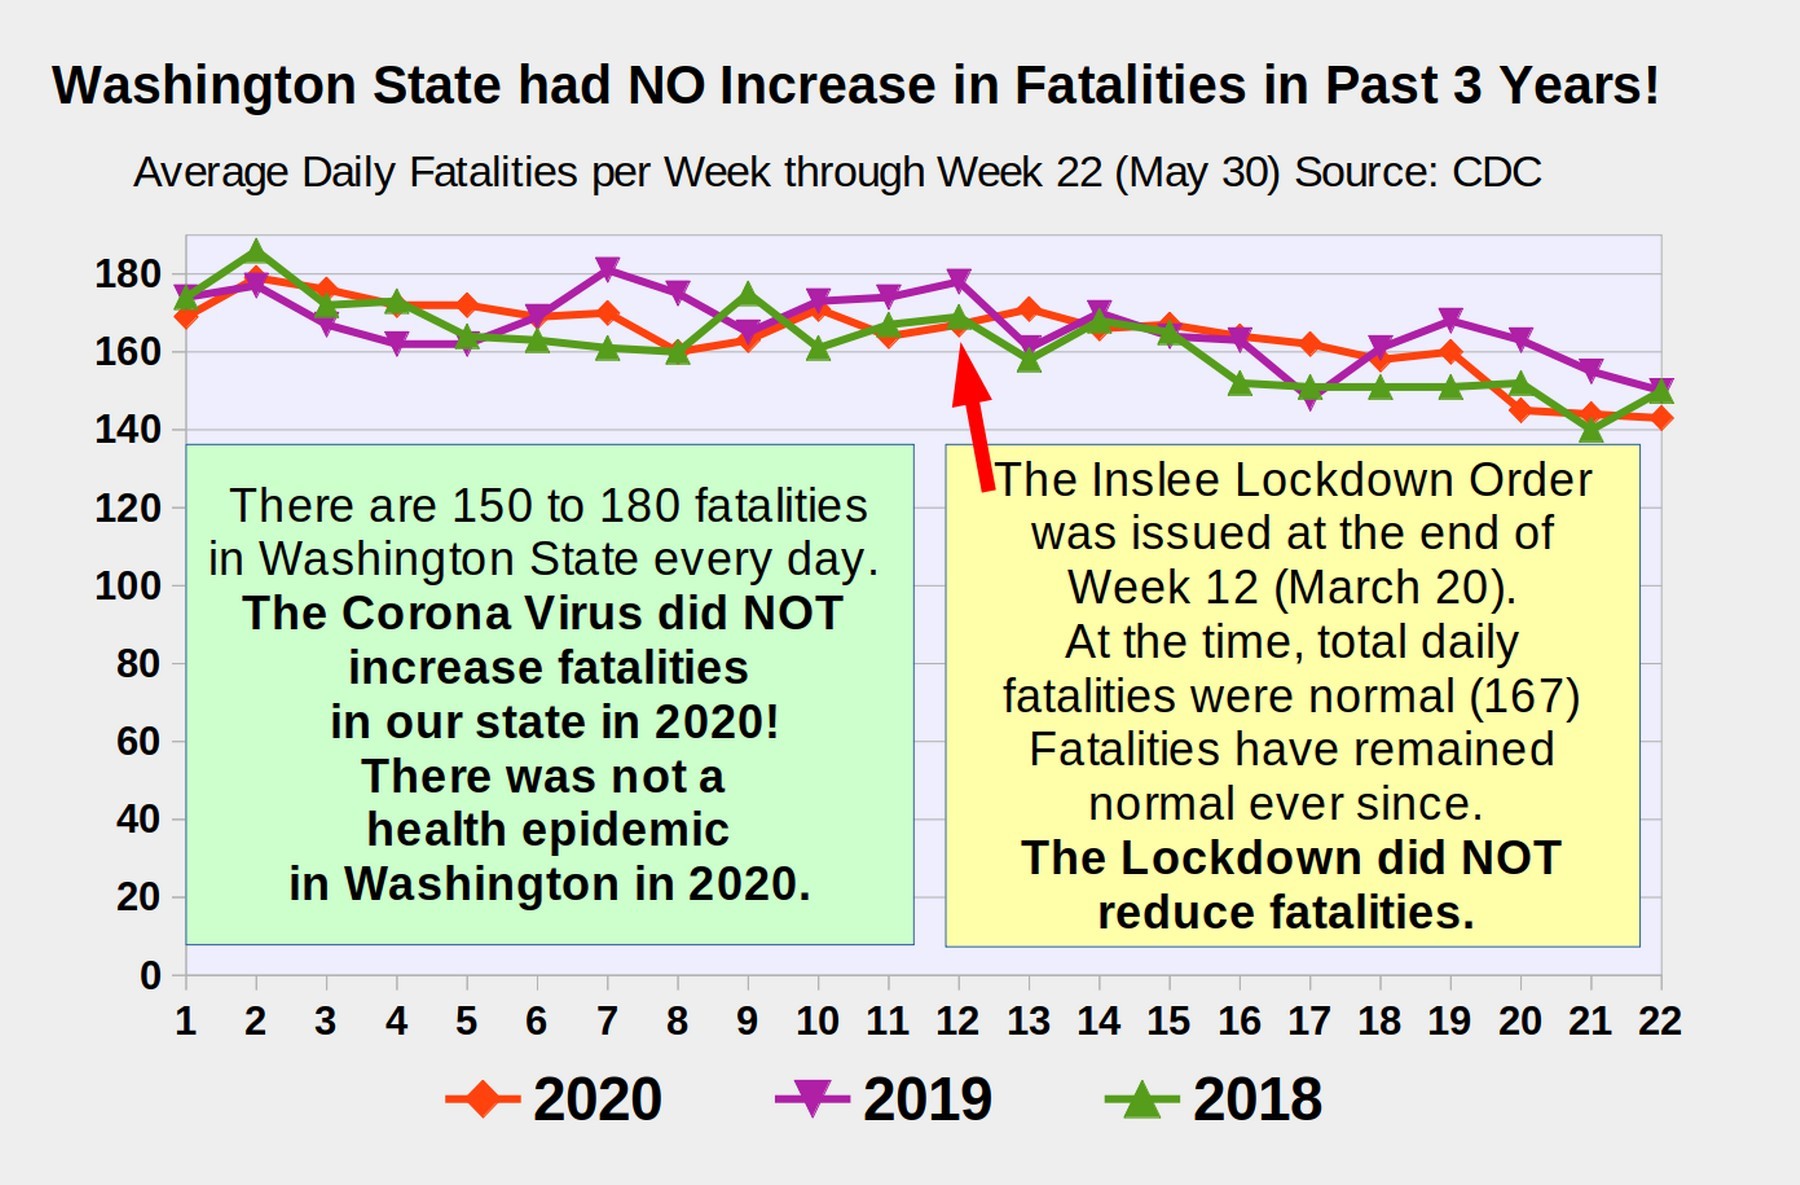
The above graph was based on CDC data as of June 20, 2020. To see CDC State data, go to this link:
https://www.cdc.gov/nchs/nvss/vsrr/covid19/excess_deaths.htm
Scroll down to Options and click on the link called Data.CDC. gov National and State estimates. Then click on View Data.
I have been using changes in Total Fatalities from year to year to estimate how many people have died in Washington state from the corona virus rather than Reported Corona Fatalities because – as I explain in detail in my book, Common Sense versus Corona Virus Hysteria – Reported Corona Fatalities include huge numbers of people who died from causes other than the corona virus. It even includes people who were never tested for the corona virus and died from things like gun shot wounds. You can read my book for free at the website Common Sense Book dot org.
Along with many other people, in order to determine whether there was an actual health emergency which would justify shutting down all schools and businesses in Washington state, I wanted to know how many people actually died FROM the corona virus. If you look closely at the above chart, you will see that the answer is that, as of June 20, 2020, no additional people died from the corona virus in Washington state in 2020 – and thus there was no health emergency which justified shutting down schools and businesses.
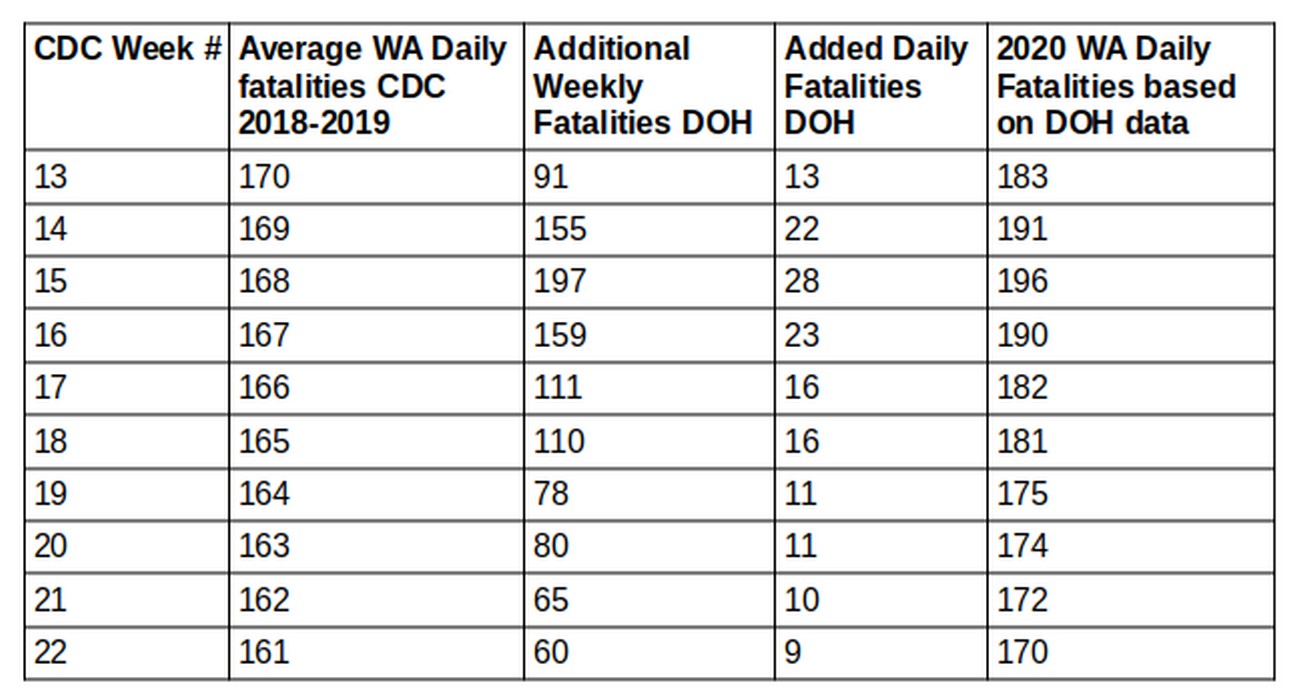
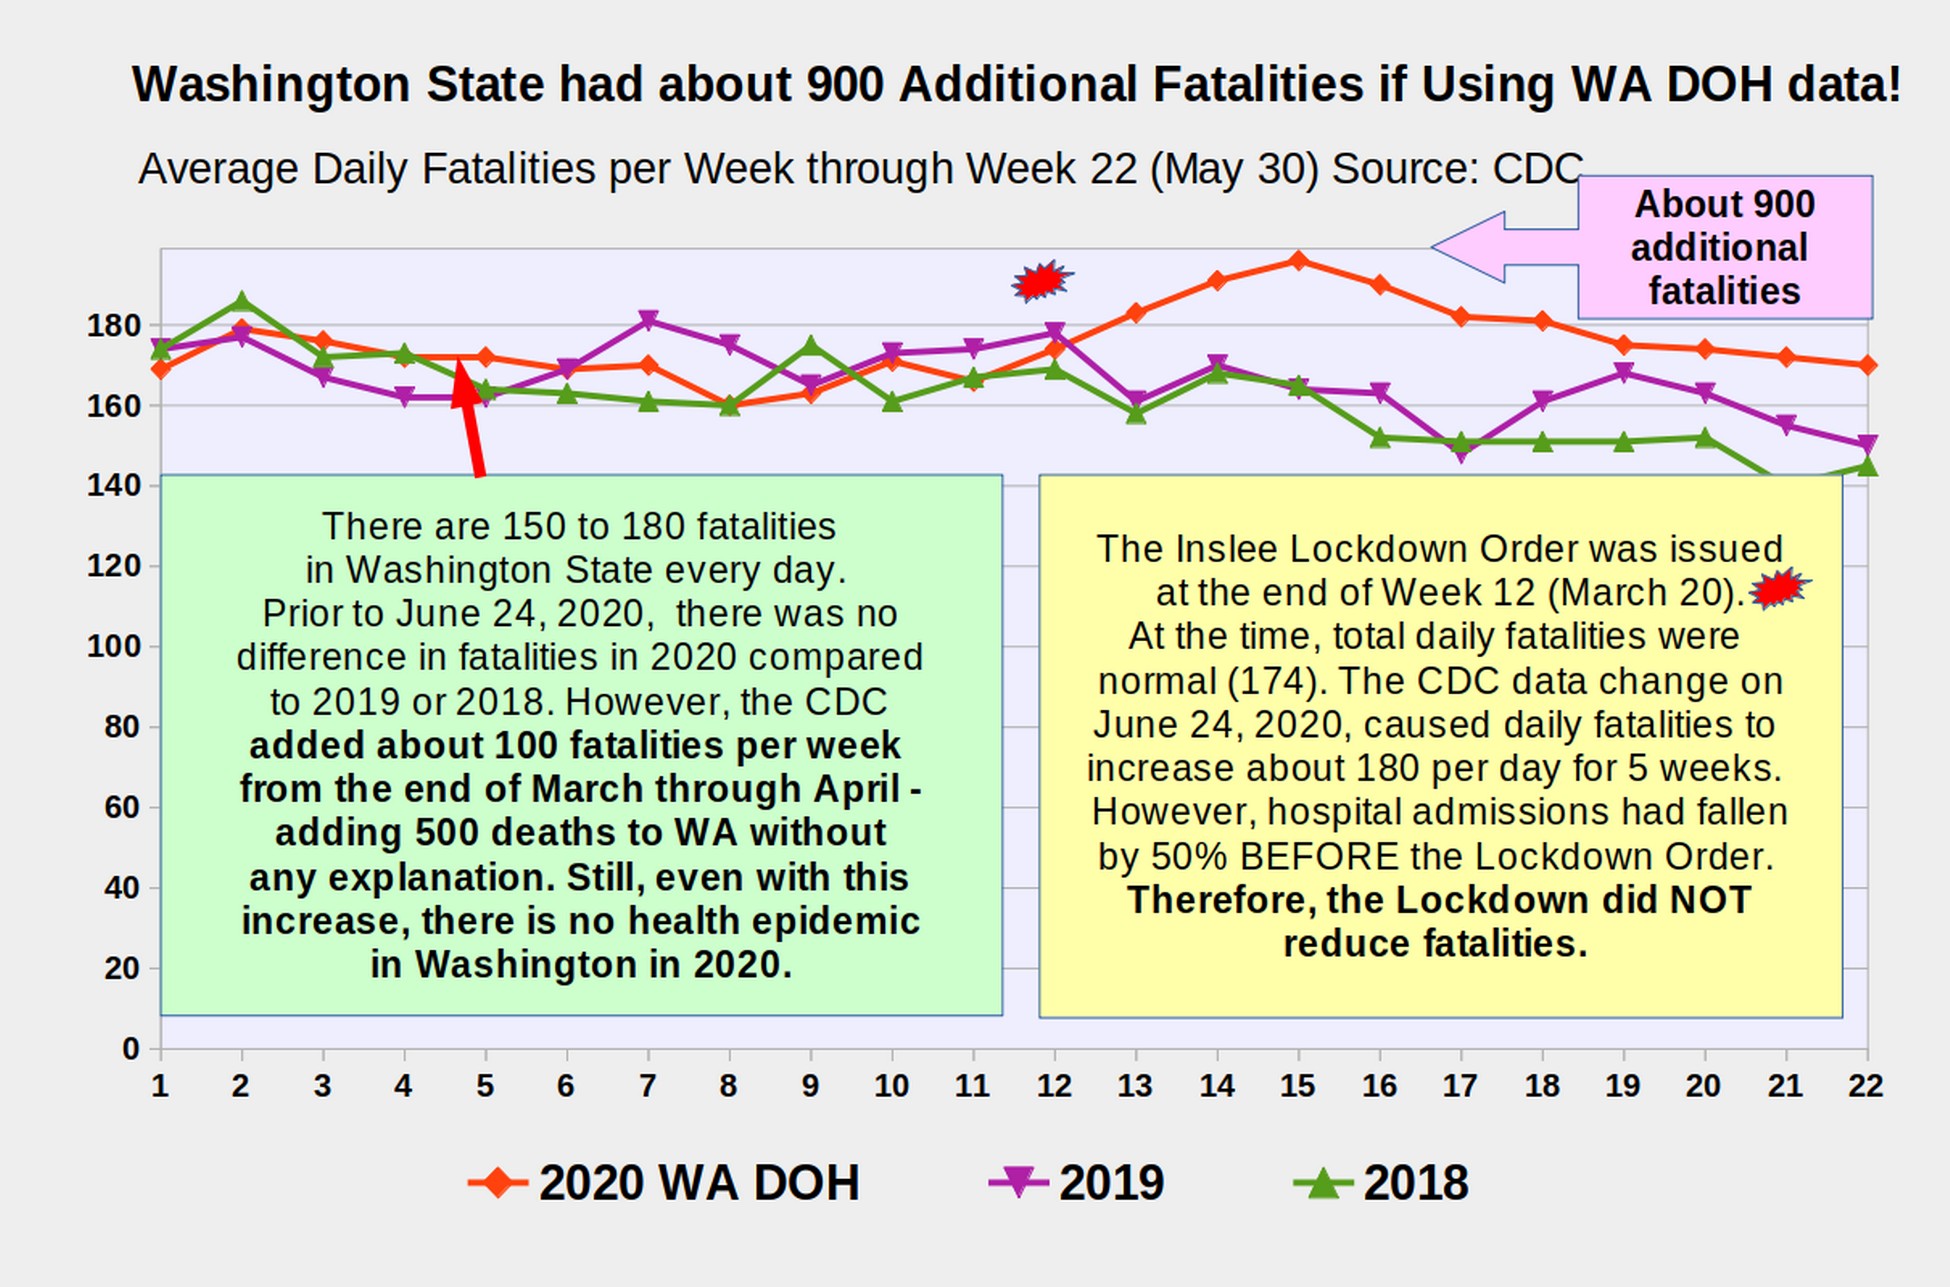
However, on June 24, 2020, I went back to the same CDC table I have been using for several months in order to update the weekly data. I was surprised to discover that the CDC had added about 100 additional deaths per week to the last week of March and the four weeks in April. Here is a graph based on the new CDC table:
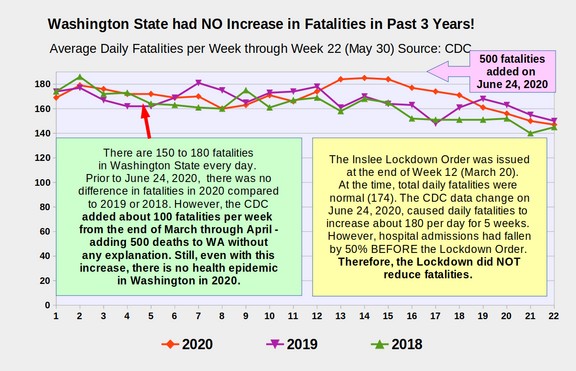
This graph and the previous graph are just through Week 22 which is the end of May. Like the graph I published on June 20, 2020, I am not including data from the month of June because the most recent three weeks undergo minor adjustments. The data for 2018 and 2019 remained the same. However, the five dots for Weeks 13, 14, 15, 16 and 17 of 2020 increased from about 165 fatalities per day to about 180 fatalities per day. Weeks 19, 20, 21 and 22 (for the month of May 2020) returned to normal.
There are several reasons to doubt the accuracy of this radical change in the CDC data table. We will consider these reasons in a moment. However, even if we accepted the 500 new fatalities as changed by the CDC on June 24, 2020 as being accurate, there is still no significant change in fatalities through May 2020 compared to prior years. The total fatalities through May 2020 were 25,005. Total fatalities for 2019 through May were 24,460. The difference is 545. This is a 2% increase from 2019 to 2020.
The tendency might be to think of these 545 additional fatalities in 2020 as corona virus fatalities. However, the average annual increase in fatalities in Washington state for the past 10 years has been 2% per year (in part due to a rising population and in part due to an aging population). Therefore, a 2 percent increase in 2020 over 2019 is the expected increase. It is not a sign of a tidal wave of fatalities due to the corona virus.
In addition, a temporary rise in fatalities has happened many times in the past without shutting down schools and businesses. For example, during Weeks 6 to 9 of 2019, fatalities suddenly rose from 160 per week to 180 per week. There was another spike from Weeks 18 to 21 of 2019. In 2018, there was a big spike from Weeks 1 to 4. None of these three spikes were reported in the news. So even if the new data from the CDC is accurate, it does not mean that there was a health emergency in 2020.
Five Reasons to Doubt the Accuracy of the New CDC Data
There are many reasons to doubt the accuracy of the new data posted by the CDC on June 24, 2020. Lets look at just a few of these reasons.
#1 The CDC is run by Drug Companies to Increase Drug Company Profits and has frequently lied to the American people in the past
I know it is shocking to find out that your federal government might be corrupt and might be lying to you. I do not make this claim lightly. Instead, I wrote an entire chapter in my book on the history of the CDC.
This history includes many examples of the CDC deliberately distorting data in the past in order to increase the profits of drug companies – even if it means killing people by the thousands. The CDC has also been caught this year manipulating data in a deliberate effort to increase Corona Virus fatalities as much as possible. If you read nothing else in my book, you need to read the chapter called 1.1 The CDC is Not Your Friend. Here is a direct link to this chapter: https://commonsensebook.org/i-corona-virus-risks/1-corona-virus-fatalities/1-1-the-cdc-is-not-your-friend
Here is a quote from the first page: “The real purpose of the CDC is to help drug companies make hundreds of billions of dollars each year peddling dangerous unproven miracle cures to the American people. The CDC is one of the least trustworthy, most dishonest and most corrupt agencies in the federal government – with a long track record of approving drugs and vaccines that later kill people by the hundreds of thousands.”
The CDC is simply not a trustworthy source of information.
#2 The CDC claimed Increase in fatalities is contrary to the huge reduction in hospital admissions that occurred several weeks earlier
Here is a graph of US weekly Flu related hospital admissions before and during the time when the fatalities were claimed to have occurred: https://www.cdc.gov/flu/weekly/weeklyarchives2019-2020/data/senAllregt24.html
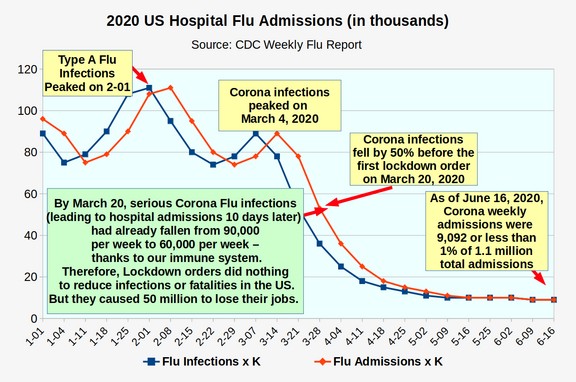
According to the CDC, corona virus hospital admissions in the US started falling rapidly on March 14, 2020 – one week before the first lockdown orders on March 20, 2020. Therefore corona virus fatalities should have started falling rapidly on March 21, 2020. In the initially reported CDC table, fatalities remained the same (not up or down) during the weeks in question. However in the new table, fatalities went up 100 per week for 5 weeks. How can it be that there is a inverse relationship between corona hospital admissions going down and corona fatalities going up???
#3 The distribution of Washington State Corona Virus related hospital admissions also do not match the claimed increase in fatalities.
The Washington State Department of Health Corona Virus Data Dashboard shows this distribution of corona virus hospital admissions:
https://www.doh.wa.gov/Emergencies/NovelCoronavirusOutbreak2020COVID19/DataDashboard
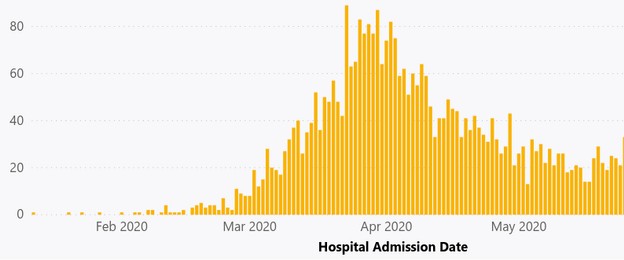
This graph confirmed that Washington State daily admissions never exceeded 80 people and that even this maximum rate occurred in the first week in April. Since the average time from admission to death is 7 days, corona fatalities in Washington state should have started falling during the second week in April. Instead, according to the newly revised data from the CDC table, corona fatalities were steady at 100 per week through the fourth week in April. In short, the revised CDC data distribution is completely different than the Washington State Corona Virus hospital admission data distribution.
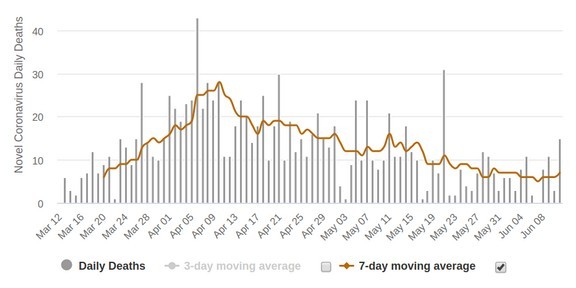
#4 Washington State Corona Virus Fatalities on Worldometer for March and April 2020 did not change
Here is a graph from Worldometer taken on June 10, 2020:
Here is the same graph taken on June 25, 2020:
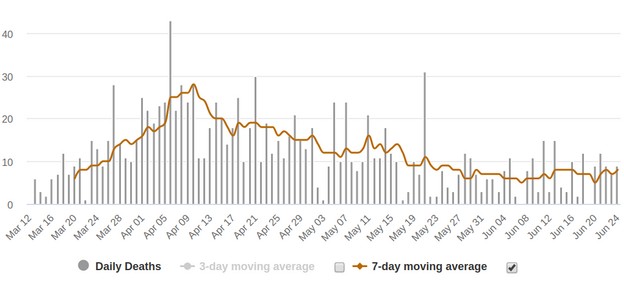
Notice that the numbers are identical for the last week of March and for every day in April. Here is the link: https://www.worldometers.info/coronavirus/usa/washington/
#5 The additional CDC Weekly Fatalities do not match the Washington State Weekly Reported Corona Fatalities for the 5 Weeks in Question
This graph is from the Washington State Department of Health Corona virus Data Dashboard at this link: https://www.doh.wa.gov/Emergencies/NovelCoronavirusOutbreak2020COVID19/DataDashboard
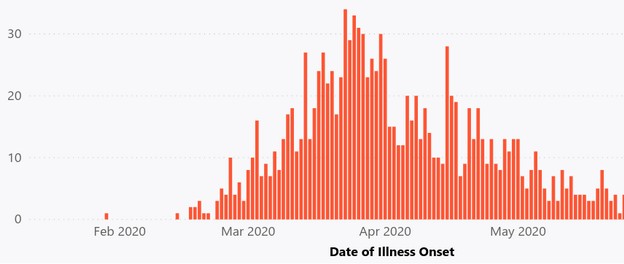
It shows claimed corona fatalities from date of illness onset rather from the date of death. The CDC reports that the average time from hospitalization to death is 7 days. Here is the link to this data: https://www.cdc.gov/coronavirus/2019-ncov/hcp/planning-scenarios.html
We therefore can use the DOH table to determine the number of reported daily and weekly fatalities by moving the DOH dates forward 2 weeks. Here is a table of additional weekly and daily corona fatalities based on the above DOH data:
Here is a graph using the Washington State Department of Health data for weeks 13 to 22:
This graph suffers from many of the same problems that the new CDC graph suffers from – naming claiming a huge increase in fatalities at the same time that there is a huge decrease in hospital admissions.
What about fatalities from car accidents?
Some have attempted to argue that the reason the CDC data did not show an increase in Washington state fatalities before June 24, 2020 was that there could have been an equal and opposite decrease in auto fatalities due to the shutdown. Their claim was that perhaps 1,000 fewer people died in car accidents during the 5 weeks in question to offset the increase in 1,000 additional people dying from the corona virus.
I therefore did an analysis of auto fatalities during the past several years. At most, about 2 people per day die in car accidents in Washington state. Assuming a 50% decline in traffic, one might expect about 1 fewer person dying per day due to the lockdown. This is only 35 people over 5 weeks – which is too small to show up in the data. In addition, I am certain that any reduction in auto fatalities were offset by increases in suicides due to one million people losing their jobs here in Washington state. Therefore, the fact that total fatalities in 2020 are not different from 2019 or 2018 cannot be explained by a reduction in auto accidents.
Conclusion
I understand that people might have a hard time believing that their state and national agencies might be lying to them. But how else can we explain the fact that the new fatality data from the CDC does not match up with the hospital admission data from the CDC? Or that the Washington State Department of Health Fatality data does not match up with either the CDC fatality data or the CDC hospital admission data?
Of the three graphs comparing fatalities in 2020 to fatalities in 2019 and 2018, only one of them matches the CDC hospital admission data – and that is the initial graph using CDC data before it was manipulated on June 24, 2020 by adding 500 fatalities with no explanation.
A fair question is why total fatalities did not fall in March and April to match the sudden decline in flu related hospital admissions. The answer is that flu related fatalities are an extremely small component of total fatalities. The primary causes of fatalities are heart attacks and cancer. The other answer is that the Null Hypothesis predicts that there will be no change in fatalities.
Any real scientist will insist on following the Null Hypothesis. It is up to those who claim to refute the Null Hypothesis to provide consistent, independently verifiable data to support their claims. This far, neither Washington State nor CDC data has been consistent or verifiable. We will therefore ignore the new CDC data from June 24, 2020 and instead use the CDC data from June 20, 2020.