Ferguson claims that attempts in US cities to control fatalities during the 1918 Spanish Flu prove that social isolation works. In fact, they prove just the opposite. More social isolation led to more fatalities.
We have been told that Extreme Social Isolation is needed to reduce the spread of the Corona Virus. But there is no scientific evidence that extreme social isolation helps. In fact, as we will soon see, social isolation may even make the Corona Virus epidemic worse!
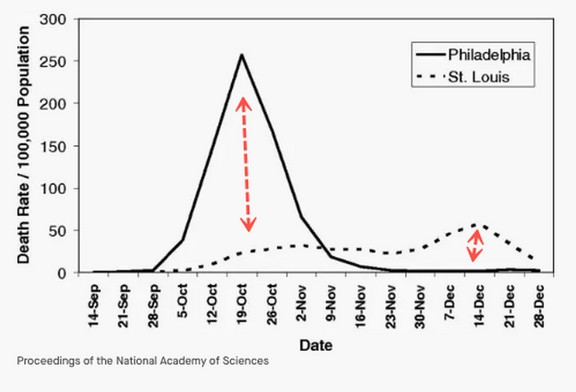
The following image is from a study published in the National Academy of Sciences in 2007. Here is a link to this study. https://www.ncbi.nlm.nih.gov/pmc/articles/PMC1849868/
The graph below claims that during the Spanish Flu epidemic of 1918, Philadelphia was a bad city that failed to practice social distancing resulting in the death of 4500 people. Meanwhile, St. Louis was a good city that “listened to health experts and told people to keep their distance from one another and avoid public places.”
The above graph is extremely misleading. The graph was taken from the 2007 Ferguson study of the social isolation actions of 16 cities in the 1918 Spanish Flu epidemic. There was a more complete study of 43 cities published in the Journal of the American Medical Association in August 2007. The study was called: Nonpharmaceutical Interventions Implemented by US Cities During the 1918-1919 Influenza Pandemic. Here is the link: https://jamanetwork.com/journals/jama/fullarticle/208354
So what happened in the other 41 cities? Here is a table summarizing what happened in all 43 cities.
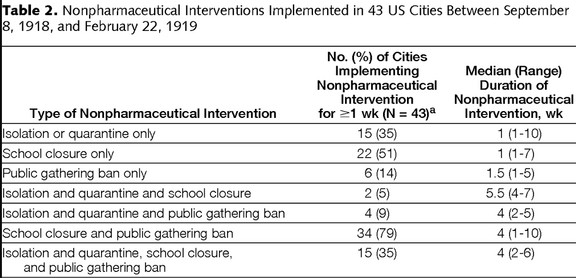
Most cities were good cities which shut down schools and public gatherings (34 cities out of 43). St. Louis shut down schools and public gatherings for 143 days. Note: 143 days consisted of shutting down schools for 10 weeks (70 days) and shutting down businesses and public gatherings for 10 weeks (another 70 days). So the study combined intervention days even though the shut downs ran concurrently. As a consequence of shutting every thing down for 10 weeks, the peak week for fatalities in St Louis was 30 per 100,000 and the total fatalities was 358 per 100,000.
The bad city, Philadelphia, only shut down schools and businesses for 100 days. This was only 7 weeks of school and business closures. Philadelphia had a peak week of 250 fatalities and a total of 750 fatalities per 100,000.
If you only look at these two cities, it sure looks like social distancing for 10 weeks is better than social distancing for 7 weeks. But what happens when you put all 43 cities on the same chart and looked at the Peak Week Death Rate for all 43 cities in the study instead of merely looking at the curves for St. Louis and Philadelphia?
Below is the graph for all 43 cities in terms of the social isolation actions they took in 1918 versus the peak weekly death rate:
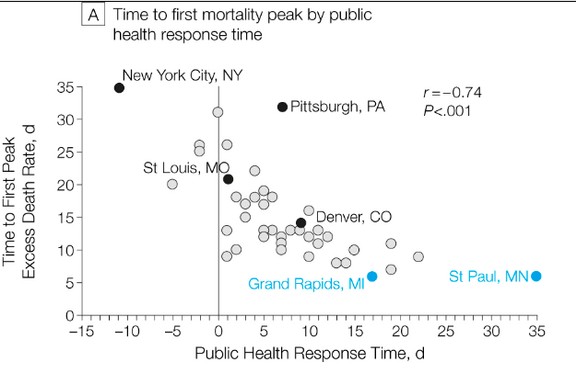
Cities on the left side had more intervention days. Cities on the far right started their interventions later and had fewer days of interventions (fewer days of closing schools & closed businesses). The cities with the most interventions did manage to delay the Peak week of fatalities by 25 to 35 days. But the delay to the peak week of cases was about 7 days before the peak week of fatalities. Thus, the delay to peak week in cases was only 18 to 28 days (3 to 4 weeks).
Meanwhile, cities on the right suffered a peak week of fatalities in just 10 days from the first case being reported in that city. Thus, the peak in cases was reached in 3 days after the first reported case. So there appears to be an advantage to social distancing in delaying the time to the peak by about 3 to 4 weeks. But there was a heavy price to pay for this minor delay as is shown on the next chart.
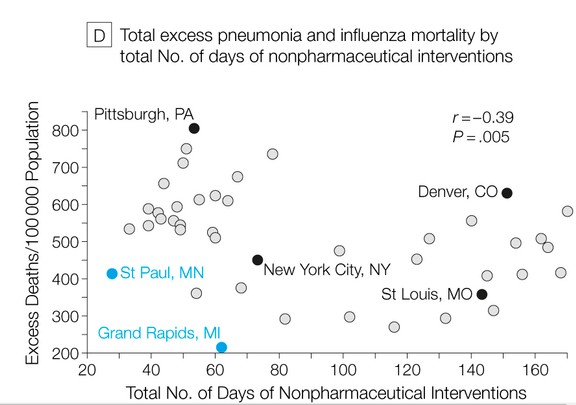
The city with the fewest days of interventions, Grand Rapids Michigan, with only 60 days of interventions (shutting down schools and businesses for 30 days or about 4 weeks), also had the lowest total death rate of 200 fatalities per 100,000 population. Our “good city” St. Louis with a 10 week shut down had more than double the days of interventions and nearly double the number of fatalities.
But why were fatalities so high in Pittsburgh and Boston (700 to 800)? The answer is not, as Ferguson would have you believe, that they did not have enough days of interventions. Rather, it was because those two cities had the highest percent of returning soldiers from the end of World War One. The soldiers brought the Spanish Flu home with them. The more infected soldiers came to a town, the more deaths there were from the Spanish Flu. St. Louis was not a good city because it enforced an extended period of extreme social distancing. It was a good city because it had fewer returning soldiers in 1918.
As we noted earlier, the Spanish Flu was 200 times worse than the current Corona Virus. In the final months of 1918, it killed nearly 5000 people in Washington state. This was with a state population of 1.3 million. Since the current population is 7.5 million, Washington state would need to suffer nearly 29,000 fatalities to have a comparable outbreak in 2020. The reason the Spanish Flu was many times worse was because the trenches of World War One were extremely unsanitary and filled with exhausted troops with weakened immune systems. These trenches became a massive incubator for the Spanish Flu. When these infected troops returned home, they caused massive outbreaks all across the US.
Yet despite the fact that the 1918 flu outbreak was 200 times worse than the 2020 flu outbreak, schools in Washington state in 1918 were only closed 4 weeks. Meanwhile, schools in Washington state and the economy of Washington state are now closed for 8 weeks due to the much smaller Corona flu outbreak.
Given that there is no proven benefit to even one week of extreme social distancing, the closure of schools and businesses in Washington state for 11 weeks is basically a crime against our kids, our jobs, our families, our businesses and our economy.
Our economic problems will only get worse if schools and businesses are closed for a year or longer while our Governor and Superintendent wait for a miracle magic bullet vaccine.
There are several important reasons extreme social distancing was not an effective response to the severe flu outbreak in 1918 and will not be an effective response to this much more minor flu outbreak in 2020. These reasons have to do with how our immune system works. We will get into these reasons in a moment. But first, because there has been a massive amount of propaganda and false claims made on the benefits of extreme social distancing, let’s look at more scientific research on the lack of effectiveness of social distancing in reducing flu outbreaks.
Evidence that Social Isolation does not Flatten the Curve
Some media reports have acknowledged that Social Isolation does not lower the total number of deaths. But they claim social distancing will “flatten the curve” so that our hospitals are not overwhelmed with patients exceeding the capacity of hospitals to care for all the victims. Here is one of these Flatten the Curve charts:
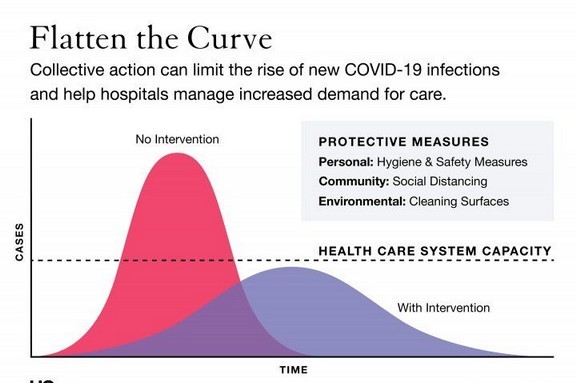
We have already shown that US hospitals were not overwhelmed by the corona virus. In fact, at the peak, they were only at 7% of capacity. Here we will show that even if they were overwhelmed, social isolation would not have reduced the problem because it does not actually flatten the curve.
Sadly, the above chart is worse than misleading – it is a blatant lie. As we have just seen from the 2007 study of 43 cities, social distancing interventions may lengthen the time to the peak week – but social distancing does not shorten the height of the peak week. The chart makes it look like, unless we shut down schools and businesses, the number of cases will double and wipe out the health care system. But here is what actually happened to the “fatalities curve” in 1918 during the last major flu epidemic when cities with the most interventions were compared to the cities with the least interventions:
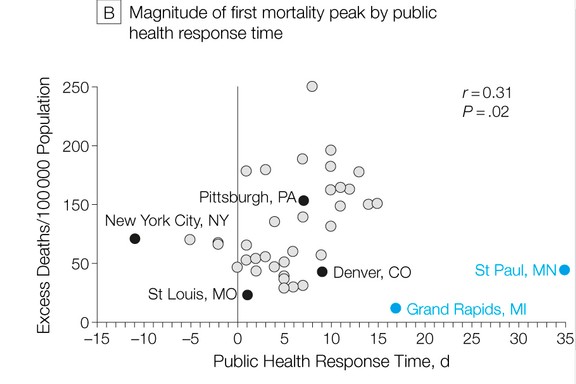
Note that the two cities that had the lowest public distancing (did the least interventions, and delayed the interventions the longest), also had the flattest curve!
Meanwhile, the city with the most interventions, New York City had a peak week fatality rate that was about double the rate of the cities that did the least intervention. Here is the exact information on these cities from the Appendix of this study: https://www.ncbi.nlm.nih.gov/pmc/articles/PMC1849868/bin/pnas_0611071104_index.html
So the truth about interventions and curve flattening is the exact opposite of what you have been told by the Mass Hysteria Media. If anything, social distancing interventions INCREASE the height of the peak cases curve and the peak fatalities curve. This means that social isolation also increases the load on hospitals.
The reason for this has to do with how the human immune system works. We will explain this dynamic after we look at a few more scientific studies on social distancing.
What’s Next?
As another example of how much you are being lied to, let’s take an even more blatant lie- the claim that shutting down mass gatherings will reduce flu outbreaks. I know this may seem hard to believe. But there is a mountain of evidence that mass gatherings of even 1000 people do not increase flu epidemics. So the idea that gatherings of more than 50 people should be restricted is basically ridiculous and not supported by any scientific evidence.