“Those who do not learn from history are doomed to repeat it.”
George Santayana
In this section, we will provide a rough historical timeline of when and how various social isolation policies were adopted here in Washington state, in the US and around the world.
2020 Flu Season Timeline
The most accurate estimate of flu prevalence in the US is a CDC table that provides a weekly summary of all hospital admissions in the US and a summary of all flu admissions. Here is a link to this table: https://www.cdc.gov/flu/weekly/weeklyarchives2019-2020/data/senAllregt16.html
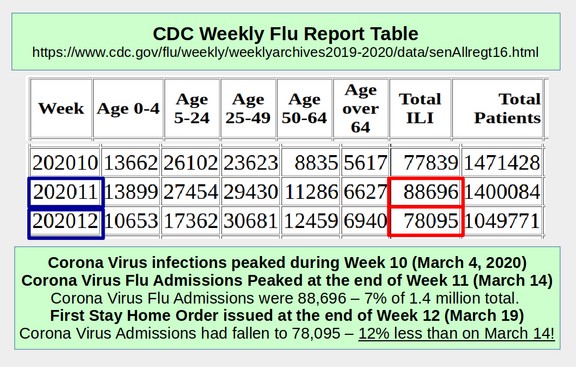
The table rows are weeks of the year. For example, the row “202011” means the 11th week of 2020 which ended on Saturday April 14, 2020. The most important column is the seventh column labeled Total ILI (ILI stands for Influenza Like Illness).
This column (in the complete table on the website) shows there were 3 flu strains during the 2020 flu season. Flu Type B hit a peak at the end of December of 95,632 admissions (which was 7.1% of all admissions that week). Flu Type A hit a peak of 110, 729 at the end of Week 6 (which was also 7.1% of all admissions that week) on February 8, 2020. The peak of total hospitalizations for all reasons occurred at the end of Week 5 which was February 1.
Corona virus admissions, (which I will call Flu Type C) hit a peak of 88,696 at the end of Week 11 which was March 14, 2020. This was 6.3 percent of all admissions that week. After March 14, 2020, total hospital admissions for the corona virus fell to 78,095 for week 12 ending March 21st.
Because it takes 10 days for flu illness to become so severe that an infected person will go to the hospital, we know that the date of peak infections for the corona virus in the US was March 4, 2020 – 15 days before March 19, 2020 when the first Stay Home order was issued in the US. By then, hospital admissions were down to 78.095 and serious cases were less than 60,000.
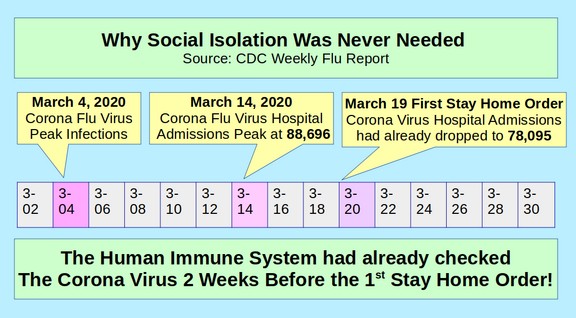
Therefore, social isolation orders had no effect on reducing corona virus infections or fatalities because our immune system had already stopped the corona virus two weeks before social isolation measures were put in place.
Here is a graph of total hospital admissions for all reasons (red line) and flu hospital admissions (blue line) in the US:
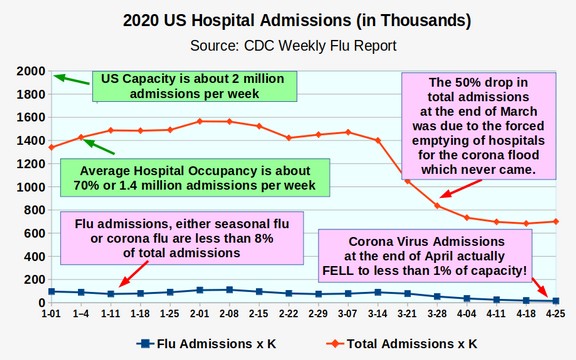
You can see that flu admissions admissions never overwhelmed US hospitals. In fact, flu admissions peaked at 7 percent of hospital admissions on February 1, 2020.
March 4, 2020 Corona Virus Flu Infections peaked
We know corona virus infections peaked on March 4 because, Corona virus hospital admissions peaked on March 14, 2020. It takes an average of 10 days for flu infection symptoms to become serious enough for people to go to the hospital.
Here is a graph showing only US flu admissions in 2020.
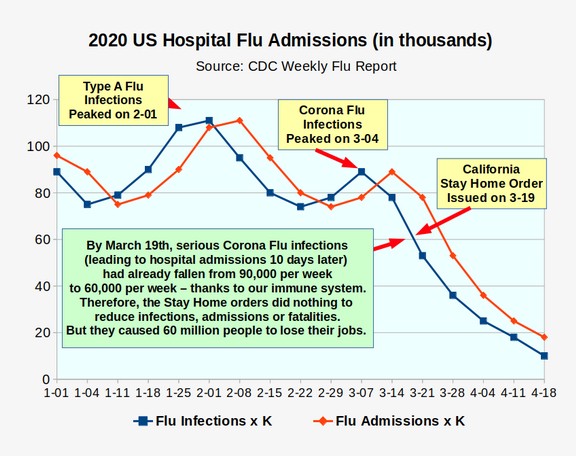
The graph uses data from US hospital weekly admissions as reported to the CDC. It shows that weekly corona virus hospital admissions peaked on March 14, 2020. Because it takes an average of 10 days for flu infections to become serious enough for people to go to the hospital, we know that corona virus infections peaked on March 4, 2020. Thanks to our immune system, corona virus infections fell dramatically well before the first Stay Home order was issued on March 19, 2020. This is why we can say for certain that Stay Home orders did not reduce corona virus infections, admissions or fatalities. All these idiotic draconian Stay Home orders did was cause more than 60 million people to lose their jobs – and about 600,000 additional people to die from suicide and drug abuse as a direct consequence of reckless government officials crashing our economy.
But Wait – What about the 30,000 new confirmed cases being reported daily by the CDC?
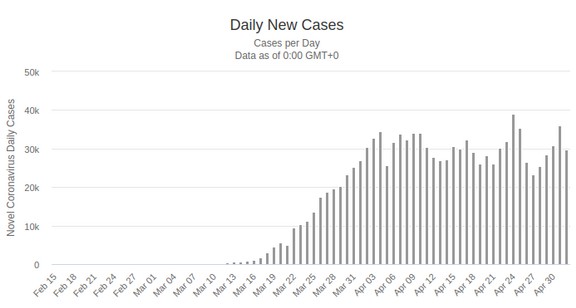
The graph above shows new cases peaked at 30,000 per day on April 1, 2020 and have remained near 30,000 new cases every day ever since. But new cases are NOT related to hospital admissions. They are simply related to the number of people tested as well as the spread of the virus in the community. The more people you test and the more the virus spreads, the more new cases there will be.
March 14, 2020 US Corona Virus Hospital Admissions Peaked
What about the ongoing corona virus fatalities being reported daily by the CDC? It takes about 30 days for the most serious cases to end in death. New admissions fell to almost nothing by May 1. Therefore, corona virus fatalities will fall to almost nothing by June 1.
If corona virus hospital admissions had already declined 40% by the time California Governor Gavin Newsom issued the first Stay Home order on March 19, 2020, then why did he issue it?
This appears to be part of a multi-billion dollar plan funded by Bill Gates. Perhaps Newsom believed the lies he was being told.
A Social Isolation Timeline
My personal social isolation nightmare began during the third week in March 2020. Several related adverse events occurred that led me to conclude that I needed to publish my research on the Corona virus and why social distancing would not reduce either cases or fatalities:
#1 On Monday, March 16, the Stock Market had a record decline of 13%. In the past 30 days, the stock market has declined from about 30,000 to about 20,000 – a loss of 33%. People who own stock lost trillions of dollars due to false claims about the corona virus.
#2 On Friday, March 20, the Governor of Washington state announced that not only all schools and colleges are closed but also all restaurants, bars, and gyms. Gatherings of more than 50 people are also prohibited as are most gatherings of less than 50 people. Thus, all sporting events have been canceled. Even the local library is now closed.
#3 My daughter came home in tears explaining that her church trip had been canceled – and three of her friends had been fired from their jobs due to their small businesses closing as a result of the governor of Washington shutting down most businesses in our state.
#4 A friend of mine was forced to fire half of her staff as her local small business was shut down as being “non-essential.”
#5 My classes at the Lighthouse Mission teaching homeless people how to start their own business was also shut down as were my classes at two local elementary schools. Shutting down these classes is not only a tragedy for me. It is a tragedy for all of my students – because we were making a real difference in their lives.
#6 Estimates are that more than 1.2 million people will lose their jobs here in Washington state and more than 60 million people nationally. As I noted previously, this is likely to increase fatalities due to heart attacks, strokes and suicides by 600,000 needless deaths as a result of government officials recklessly shutting down nearly all businesses.
#7 The US Federal Reserve and Congress announced trillions of dollars in bailouts to try to keep major corporations afloat. This huge cost will eventually be paid by US tax payers. Assuming the bailout reaches $10 trillion, each American will be $30,000 more in debt. This is a cost of $10,000 per month for each month of our 3 month forced vacations.
#8 Numerous cities have closed their local parks – denying children a place to get exercise. This is on top of the malls closing and the local gyms all closing. Apparently the government wants every one to stay inside on their couches watching the Mass Hysteria media talk about the dangers of the corona virus all day long.
#9 On Thursday March 19, 2020, the Governors of California issued a statewide “stay at home” order – despite the fact that corona virus infections had already been falling for more than 2 weeks. The Governor of California also closed all playgrounds in California and stated that he believed that 300,000 people will die in California from the Corona virus in the next 8 weeks. We have shown that this can not possibly be true. But it will certainly scare people in California which is the real goal. As of April 30, 2020, California had 1,954 deaths – and might not go over 3,000. Thus, the governor of California over-estimated corona virus fatalities by a factor of 100! Here is the Governor of California surrounded by the police and national guard.
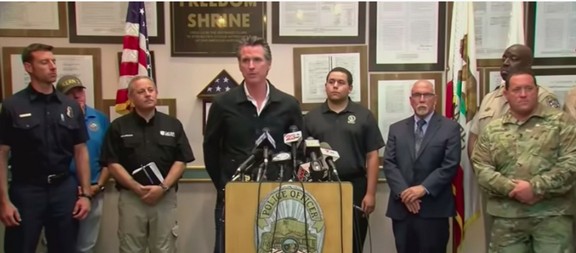
Note they are not 6 feet apart – and they are not wearing facemasks.
#10 On Friday, March 20, 2020, the governors of New York and Illinois issued Stay Home orders in their states.
#11 Also, on Friday March 20, 2020, Washington Governor, Jay Inslee held a press conference in which he asked all state residents to voluntarily hide in their houses.
Here are some shocking quotes from the Inslee Press conference: “Stay home unless it is necessary for you to go out. Older people should not go out any more unless it is essential. It is too dangerous for your grand kids and your family to be close to you. If you are a young person and you go out to a restaurant, the penalty is you might kill your grandparent. It is a moral crime to put other people at risk.”
This is how low things have sunk here in Washington state. Kids are no longer allowed to hug their grandparents without the fear of killing them and anyone who leaves their house for anything other than an emergency is putting the lives of other people at risk. Pure insanity has taken over. None of these statements is supported by even the slightest scientific research.
#12 On March 23, 2020 Inslee held another press conference in which he stated that not enough people were complying with his “voluntary order” to stay home. He therefore was forced to make the order mandatory. This new order included mandatory closure of all “non-essential” businesses and all public parks.
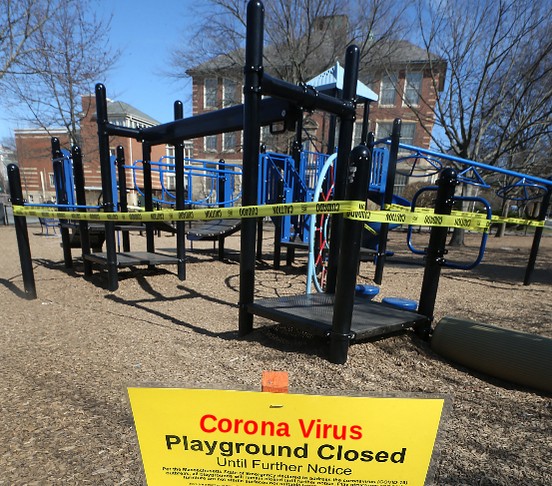
What is most disgusting about the closure of public parks is that going outside and playing at the park is one of the best ways to improve a child’s immune system. The other disgusting thing is that children under the age of 18 have been shown to have almost no chance of getting the corona virus. Despite these two facts, all parks and playground in Washington state were closed by Jay Inslee on March 23, 2020.
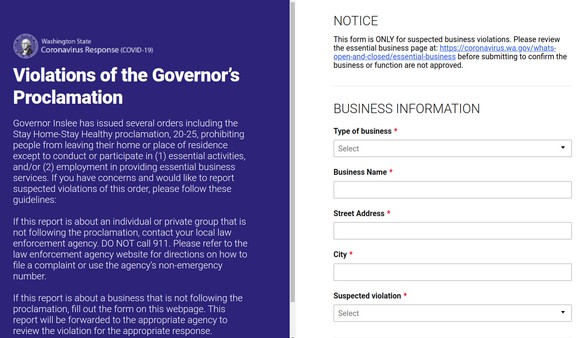
#13 On March 30, 2020, Inslee held another press conference at which he announced that the state has set up a website where people can report neighbors and local businesses that were not complying with his orders to stay inside.
#14 On Thursday April 2, 2020, Inslee held another press conference. This time he announced that he was extending the shutdown of all schools and nearly all businesses in Washington state to at least May 4th. People are supposed to stay inside their homes unless they need to go get some food. As we cover later in this book, his order was a gross violation of the US Constitution and the Washington State Constitution.
#15 On Monday, April 6, 2020, Washington state Superintendent of Public Instruction Chris Reykdal held a Press conference with Governor Inslee and announced that all public schools in the state would not reopen this year. Reykdal said that a challenge to moving all classes online was that many students did not have internet access. He then said that internet access should be a basic human right just like having safe drinking water. The irony of this statement is that half of the public schools in Washington state do not have a safe source of drinking water. So much for Reykdal being concerned about basic human rights like drinking water. For graduating seniors, Reykdal says not to worry. He will waive credits for students who need it. Because schools will remain closed for the rest of this school year, Reykdal says students would lose about 320 learning hours – or 2.4 percent of a student’s entire education. What he failed to note was that 320 hours is 30% of the current school years learning time.
#16 On Tuesday April 7, 2020, Washington Governor Jay Inslee announced his veto of $445 million in state funding to “prepare for the loss in revenue brought about by the pandemic.” But it was not the pandemic that caused the loss in revenue – it was Inslee closing nearly all of the businesses in Washington state. Among the cuts was $100 million that would have added urgently needed counselors to our public schools. I guess if we are not going to have real schools, there is no need to have real counselors.
Also on April 7, 2020, the Washington State Transportation Department announced a 45 percent decline in State gas tax revenue. This will mean that 45 percent of transportation projects will need to be cut and 45 percent of transportation construction workers will lose their jobs in the coming months. This is at a time when our bridges and roads already have a $20 billion backlog of urgently needed projects.
#17 April 10, 2020. Church goers were fined $500 for attending service.
On the week before Easter Sunday, churches in Kentucky and Greenville, Mississippi attempted to hold church services where worshipers would remain in the safety of their cars in the parking lot while the minister broadcast the service over a loudspeaker system or on a local radio channel. In both cases, police raided the church services and gave tickets to the worshipers of $500 each. Charles Hamilton, pastor of King James Bible Baptist Church stated:
"The police in Greenville, MS went to Temple Baptist Church this evening and gave everyone there a ticket for $500 because they had a drive in service.
Everyone was in their cars with the windows up listening to pastor Arthur Scott preached on the radio. What is harmful about people being in their cars listening to preaching with their windows up? Christians do you all see what is going on?"
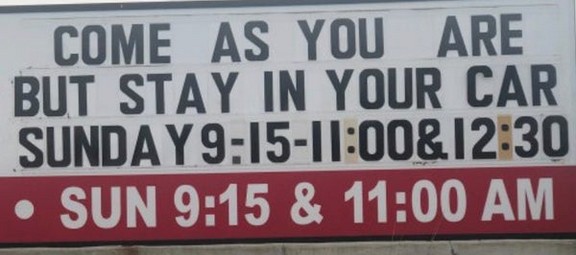
"I told them to get some more tickets ready because we will be preaching Sunday morning and Sunday night. The police officer said I might go to jail. If it means going to jail and if it takes that for me to keep preaching, I’ll be glad to go to jail."
#18 On Saturday, April 11, 2020, a Kentucky judge, Justin Walker, ruled that it was contrary to the 1st Amendment to the US Constitution to shut down drive in church services. The judge noted that the government allowed drive through restaurants and even drive through liquor stores to remain open. So church services would be allowed to continue. Here is a quote from his ruling:
“On Holy Thursday, an American mayor criminalized the communal celebration of Easter. That sentence is one that this Court never expected to see outside the pages of a dystopian novel, or perhaps the pages of The Onion. The Mayor’s decision is stunning. And it is beyond all reason,’ unconstitutional.”
https://apnews.com/28cb3aeb9345392f336b77e4b3da5bf3
#19 Also on April 11, 2020, a study was published by Stanford University which concluded that the corona virus was 50 to 84 times more prevalent than previously thought. This also meant the mortality rate from the corona virus was 50 to 84 times LESS than previously thought. Here is a link to this study: https://www.medrxiv.org/content/10.1101/2020.04.14.20062463v1.full.pdf
This may be one of the most important scientific studies ever published as it confirmed that the corona virus was not much more lethal than the seasonal flu. This study measured antibody presence in 3,330 people from Santa Clara CA and found huge numbers of people had the corona virus with no apparent symptoms – and thus were spreading the virus throughout the community. This study was supported a week later by similar studies from the State of New York and LA – both of which also concluded that the prevalence of the corona virus was about 50 times greater than previously thought.
This study makes it clear that the human immune system can destroy the virus in well over 99% of all cases. It also means that plans to contain the virus through social isolation are doomed to fail.
Critics of the study claimed that it was not yet peer reviewed. What these critics failed to point out was that the Ferguson study which claimed that 2.2 million people would be killed in the US and which formed the basis of government policy to shutdown the economy was also never peer reviewed. In fact, almost none of the corona virus studies published thus far have been peer reviewed.
A second complaint was that the sample was not a random sample. What this complaint overlooks is that the authors of all three studies showed that the demographics of the sample matched the demographics of the community represented by the sample. In addition, both confirming studies were random samples and got the same result. But most important, the Ferguson study used to shut down the economy did not use any sample at all. One has to wonder why critics are suddenly concerned about sample bias when they had no concern at all about the Ferguson study.
A third, more valid criticism is that the corona virus antibody test used in the study has high false positive and false negative error rates. Similar unreliable antibody tests were used in the New York and LA studies. This does not change the result of the study – but it could reduce our confidence in the accuracy of the study - if it were only one study that found actual cases were 50 times previously confirmed cases. However, when you get three different major studies from 3 different parts of the US – all of which found the same result – then we can conclude that the inaccuracies of the anti-body test method in terms of false positives and false negatives tend to balance out.
More to the point, those who now criticize the antibody test as being inaccurate fail to admit that the test they have been using to “confirm” corona virus infections – the PCR test – may be even LESS accurate than the antibody test.
A final criticism of the Santa Clara antibody study was that “extraordinary claims require extraordinary evidence.” This claim is turning the scientific method upside down. It is not an extraordinary claim for a study to provide evidence that the corona virus is similar to all other flu viruses in terms of prevalence, transmission and mortality. Indeed, the null hypothesis is that any flu virus or cold virus is like any other flu or cold virus until proof is provided that the new virus is different from the existing viruses. Up until now, no such proof has been made.
Claiming that the corona virus is a lethal weapon 50 times worse than the seasonal flu is the Extraordinary Claim. This claim does indeed require exceptional evidence before government officials can justify shutting down the economy for months on end, destroying millions of small businesses and putting 60 million people out of work. Yet all that was used to justify this claim was the discredited Ferguson study – which was paid for by more than 100 million dollars from Bill Gates.
Thanks to the Santa Clara, LA and New York studies, we can rest assured that the null hypotheses, that the corona virus is about the same as the seasonal flu, has been upheld. But the truth is that no evidence is needed under the scientific method to uphold the null hypotheses. I am certain that dozens of additional studies will be released in the next month and I am equally certain that they too will confirm the null hypotheses. The truth is a powerful weapon. No amount of money by any billionaires and no degree of corruption by any government officials can keep the truth hidden forever.
#20 On Monday, April 13, it was announced that Washington hit the peak in daily Corona Virus fatalities perhaps on Saturday April 11. The rest of the nation is still a few days away.
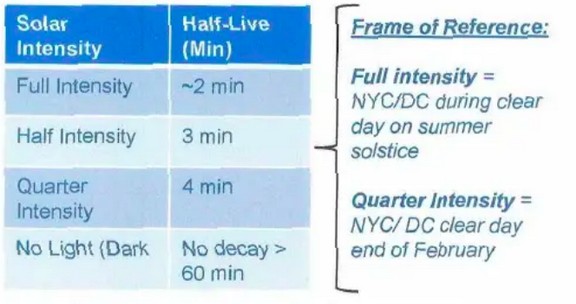
#21 Also on Monday, April 13, 2020, a study was released confirming that the corona virus was destroyed by sunlight.
The National Bioforensic Analysis and Countermeasures Center (NBACC) - which is part of the Science and Technology Division of the US Department of Homeland Security - released a study on April 13, 2020, called Research, Development , Testing and Evaluation Efforts re Covid-19. This study found that Covid-19 was destroyed when exposed to direct sunlight. Here is a graph of how long the virus persists on a stainless steel surface when not in sunlight:
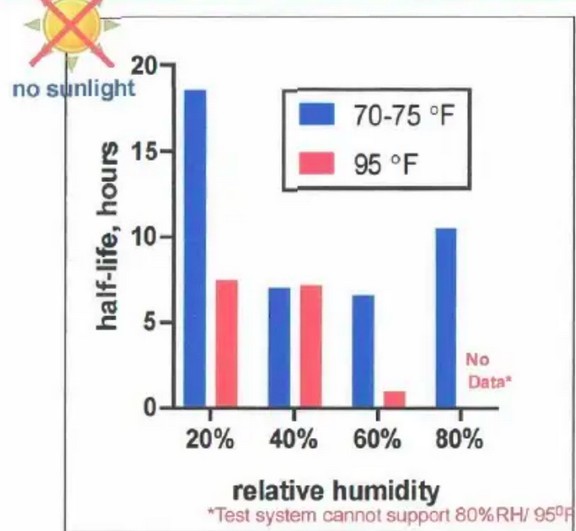
With no sunlight, at a normal temperature, and low humidity, such as might occur in the evening in the middle of winter, the virus can survive for up to 18 hours. However, with sunlight, even in winter the survival time drops down to less than 8 minutes. In the summer, when exposed to direct sunlight, the virus survival time drops down to less than 3 minutes. Here is a link to this study: https://www.scribd.com/document/456897616/DHSST#download&from_embed
This is one reason the corona virus will be less prevalent in the summer than in the winter. But the most important reason corona infections will fall dramatically during the summer is that the human immune system is much stronger in the summer than in the winter.
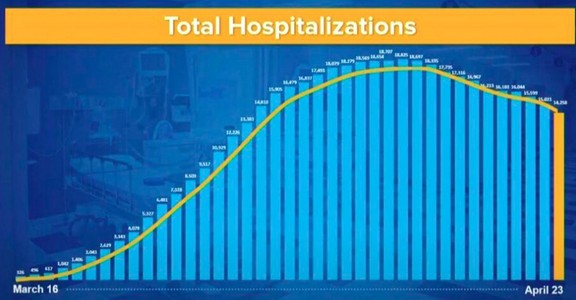
#22 On Tuesday April 14, a downward trend was established in New York confirming a peak is close.
On April 4, 2020, total New York Hospitalizations began to decline. The number fell from over 1000 to 574. Since then, the number of new hospitalized in New York has fallen rapidly. The number of discharges have also increased rapidly with daily discharges now over 1,700 while new admissions are only 200. This means that the corona virus death count in New York should begin to decline by April 15, 2020. It also means that New York City hospitals should no longer be at capacity within a few days. This also means that nationally, the number of daily fatalities should begin to drop by April 29, 2020. Below is a graph of total hospitalizations in New York as of April 23, 2020:
#23 Also on April 14, 2020, Washington state Governor Jay Inslee gave an interview on a local radio show in which he made some extremely disturbing statements indicating he was completely aware of the spread of the virus or the inaccurate nature of tests for the virus. https://omny.fm/shows/kiro-nights/governor-jay-inslee-joins-kiro-nights
Here are a couple of his statements followed by my comments.
Inslee: We want a transition to a smart approach, which is individualized, which can protect individuals. And when they get a fever, make sure they're tested immediately and making sure we have contact tracing for everyone they've had contact in, sort of like a fire brigade. We want to have fire brigades when your house is on fire, you call and you get, you know, service in minutes. We need to do the same thing for individuals.
My comments: Inslee seems to be completely unaware that 95% or more of all Corona virus cases do not have any symptoms. There is no fever to alert us that a person has the corona virus. This makes the corona virus much different from a house fire. We know for sure when a house is on fire because smoke is always present. So his plan to treat the corona virus like a house fire is doomed to failure.
The second problem with his shocking statement is that he seems to be completely unaware of how inaccurate corona virus tests are. There are huge numbers of false positives and huge numbers of false negatives. Inslee placing his faith in virus testing is like placing his faith in fire trucks that go to the wrong house half the time and even when they do go to the right house, water never comes out of the fire hose. Whoever is advising Inslee is giving him very bad advice.
Inslee: “We need to have that testing and contact tracing capability so that the curve of fatalities would not come back up again.”
My comments: Again Inslee is showing a complete lack of awareness of how inaccurate the tests are. Inslee then refers to swabs and the UW testing lab. These comments make it clear that his plan is to do mass PCR testing (something I do not think has ever been done before). This means that the tests will not only be extremely inaccurate, they will also be extremely expensive.
For more on the cost and drawbacks of PCR tests, see Chapter 5, Sections 5.1 and 5.2. Inslee also seems to be completely unaware of the fact that what is going to cause the curve of fatalities to go back up again is his own mandatory extreme isolation policies which are preventing the population from gaining herd immunity to the virus in a safe way and at a time (spring and summer) when our immune system is strong rather than at a point (fall and winter) when our immune system is weak.
Inslee: “I think the virus is going to be with us for years, or less depending on when we really get a vaccine or a palliative medical procedure, there are several trials being held today, some and in Washington State to try to get a treatment for the disease even before a vaccine. “
My comments: Inslee seems to be completely unaware that there has never been an effective long term vaccine or magic bullet drug treatment for any flu virus – due to the extremely rapid mutation of viruses. It’s like he skipped the class on viruses in health class when he went to public schools.
Inslee: We sort of been plateaued for a period of time and we need to get down to zero or close to zero. And at that point we bring in this fire brigade approached to prevent new infections from starting up. That's a place where we can then begin to reopen our businesses and get back to our social lives that are more acceptable.
My comments: This is perhaps his most shocking comment. I am certain that at some point this summer the number of corona virus cases will drop to near zero. But it will not be due to social distancing. It will be due to stronger immune systems in the summer. But conditioning the re-opening of businesses on zero or close to zero cases means that it is going to be a long time before businesses re-open – and also presents the danger that when the second wave hits in October 2020, Inslee will just shut all businesses back down again.
Inslee (in response to a question of whether the PCR test or the antibody test is more useful to help get people back to work with some sort of test ID card): I think they're both important. I don't know how to choose between them. They work in concert, obviously the RNA test is good, but it doesn't tell you whether you actually have the disease now or not, and we don't know yet whether even having the antibodies makes you a non transmitter.
My comments: Once again, Inslee is not aware that both the PCR test and the antibody test (which he mistakenly calls the RNA test) are extremely inaccurate. As for whether a person can transmit the virus even when they have antibodies, the answer is yes they can. This is why we need to focus in on improving the immune system rather than trying to avoid the virus. For more on asymptomatic transmission, see this April 4, 2020 article: https://www.businessinsider.com/coronavirus-carriers-transmit-without-symptoms-what-to-know-2020-4
In a study on the antibody question published on March 4, 2020, even though many patients were extremely ill, it took up to one month for antibodies to appear. The median time was 12 days. In the first 7 days, the RNA test (PCR test) was accurate 67% of the time while the antibody test was accurate 38% of the time. The antibody test became much more accurate over time while the RNA test did not. Here are a couple of quote from the study: “The real-world performance of PCR based RNA testing is unsatisfied. Many suspected patients had to be tested for several days with multiple samples before confirm diagnosis were made.” (in other words, PCR tests have many false negatives).
“ For healthy close contact who is in the quarantine period, he/she should be deemed as a probable carriers if antibody positive.” https://www.medrxiv.org/content/10.1101/2020.03.02.20030189v1.full.pdf
I should add that the reverse is also true. People can be antibody positive even though they have never had the corona virus. This is because the antibody test has a huge number of false positives in that it is actually picking up antibodies for the human cold which is closely related to the corona virus.
Because antibody tests have all kinds of problems, on April 8 2020, the World Health Organization published a statement warning against the use of antibody tests in making critical decisions. Here a quote:
"Inadequate (antigen) tests may miss patients with active infection or falsely categorize patients as having the disease when they do not. At present, based on current evidence, WHO recommends the use of these new tests only in research settings. They should not be used in any other setting, including for clinical decision-making, until evidence supporting use for specific indications is available.”
Here is another quote: “the sensitivity of these tests varies from 34% to 80%. Based on this information, half or more of COVID-19 infected patients might be missed by such tests, depending on the group of patients tested. These assumptions urgently require further study to understand whether they are accurate. Additionally, false-positive results – that is, a test showing that a person is infected when they are not – could occur if the antibodies on the test strip also recognize antigens of viruses other than COVID-19, such as from human corona viruses that cause the common cold… Antibody detection tests targeting COVID-19 may also cross-react with other pathogens, including other human corona viruses (aka the common cold) and give false-positive results.”
https://www.who.int/news-room/commentaries/detail/advice-on-the-use-of-point-of-care-immunodiagnostic-tests-for-covid-19
Here is a quote from a recent NPR article on the problem of antibody test false positives: “Because of these significant limitations, antibody tests fall short of being the imagined passport that would allow people to get back to business as usual and ignore the corona virus.”
https://www.npr.org/sections/health-shots/2020/04/15/834497497/antibody-tests-for-coronavirus-can-miss-the-mark
If a reporter from NPR can figure this out, why can’t Inslee?
#24 On April 15, 2020, the US Commerce Department announced record declines in retail sales.
Auto sales dropped 25%. Clothing store sales dropped 50%. Restaurant revenue dropped 27%. The report doesn’t include spending on services such as hotel stays, airline tickets, or movie theaters, all of them suffering severe declines due to locking down the entire US economy. Economists at JP Morgan Chase now forecast the US economy will shrink by a record-shattering 40% in the April-June quarter. Discretionary spending by shoppers is expected to collapse 40%-50% in the first-half 2020, according to Fitch Ratings. More than 250,000 stores, including Macy’s, Nordstrom and Nike, which sell non-essential merchandise have been shuttered since mid-March. That’s 60% of overall US retail square footage, according to Neil Saunders, managing director of Global Retail Research https://www.kxnet.com/news/national-news/us-retail-sales-plunge-a-historic-8-7-in-march-a-drop-not-seen-in-a-century/
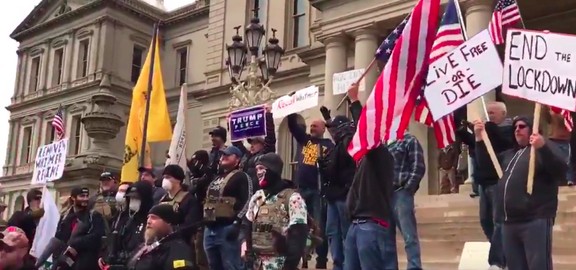
#25 Also on April 15, 2020, protesters surrounded the Michigan State Capital
Supporters of the Michigan Conservative Coalition requested that Governor Gretchen Whitmer reopen the economy on May 1 and ease restrictions to return life to normal. They circulated a petition to have her recalled — one that generated more than 200,000 signatures — while more than 300,000 Facebook users joined a group titled "Michiganders Against Excessive Quarantine".
Matthew Seely, a spokesman for the Michigan Conservative Coalition, said the event is intended to be "nonpartisan."
"We are asking people to become united on this one issue — all Michiganders to say we've gone too far," he said. "We're responsible adults and can be trusted to go out in public."
Thousands of cars blocked off access to the capital for several miles. Here is an image of the protesters on the steps of the state capital.
#26 Also on April 15, 2020, the Pennsylvania State Senate voted to end the state lock down. Senate Bill 613 requires Governor Wolf to align state policy with federal guidelines in reopening businesses. This would mean that businesses in Pennsylvania could reopen as soon as May 1, 2020. It is unknown if the governor will veto the bill.
#27 On April 16, another 6 million jobs were lost for a total of 23 million jobs lost in the past three weeks. At the same time, we learned that the bailout bill gave 24 billion to billionaire Jeff Bezos during the same time that 23 million Americans lost their jobs. https://www.zerohedge.com/personal-finance/bailouts-secured-bezos-wealth-soars-24-billion-17-million-americans-lose-their
#28 Also this week, the Clark County Council drafted a letter to the Governor of Washington asking him to amend his isolation policy to allow construction workers to go back to work.
#29 Also this week, the City of Lynden Washington decided to defy the Governors Construction ban by letting construction workers know they can go back to work in the city of Lynden. Good for you Lynden. Be Brave!
#30 On April 17, 2020, the federal government announced a 3 Step plan for re-opening the economy. The problem with the plan is that for any state to re-open would require that state to have a downward trend in corona virus new cases for at least 14 days. Currently, not a single state has such a downward trend. States will also need to have widespread availability of tests – which not a single state has – and the ability to track and isolate all cases – which none of them have. What is not mentioned is that none of the current tests are accurate. In short, the federal plan is doomed to fail.
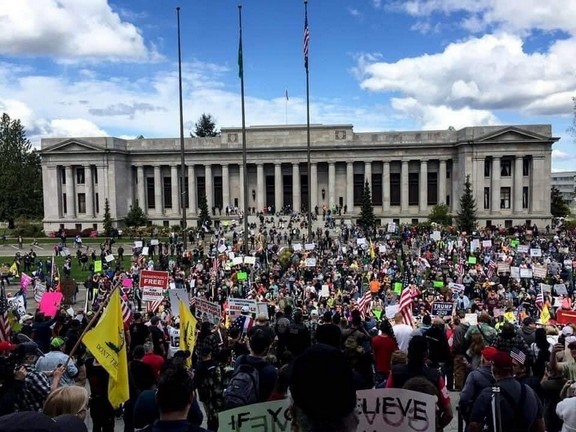
#31 On April 19, 2020, there was an huge rally/protest in Olympia, the State Capital, of people wanting the Governor to let people go back to work. There is also an online petition with 21,000 signatures asking Inslee to allow construction workers to go back to work. Here is a picture of the protest:
#32 Also on April 20, 2020, the price of oil dropped to negative for the first time in history – indicating that the world economy is the worst in history.
#33 Also on April 20, 2020, Facebook banned all posts and page organizing anti-lock down protests. "Events that defy government's guidance on social distancing aren’t allowed on Facebook," said Facebook spokesman Andy Stone.” This is why, near the end of this book, I have included a section on how groups can create social organization tools that they control rather than using organization tools controlled by billionaires.
#34 Also on April 20, 2020, Georgia Governor Brian Kemp announced that he would lift the business shutdown in Georgia in the next five days – despite the fact that Georgia did not meet any of the federal requirements to re-open.
#35 On April 21, 2020, the Washington State Department of Health published a study summarizing all corona virus admissions in Washington state. This study confirmed that – even at the height of the epidemic, corona virus patients only took 7% of the available hospital beds in Washington state. They currently occupy less than 1 % of the beds – meaning that the claim that hospitals in Washington state would be overwhelmed was a complete farce. Still on the same day, Inslee said that his economic suicide order must continue.
#36 Also on April 21, 2020, a mother was arrested for taking her two kids to a public playground. So we have people being arrested for attending church and taking their kids to the park at the same time that convicted felons are being let out of prison. This is why I content that government officials have gone completely crazy. Here is a link to the YouTube video of the arrest. https://www.youtube.com/watch?v=hq9Gv7Uolsg&feature=emb_logo
#37 On April 22, 2020, computer modelers from the University of Washington (funded by Bill Gates) announced that Washington would not be able to re-open until the end of May. http://www.healthdata.org/covid/updates
Here is a shocking quote from their latest report:
“When all occurring infections in a location, not just new ones – fall below 1 infection per 1,000,000 population... locations could potentially identify via active case detection and contact tracing.”
They then presented this map of when they felt States would meet this standard:
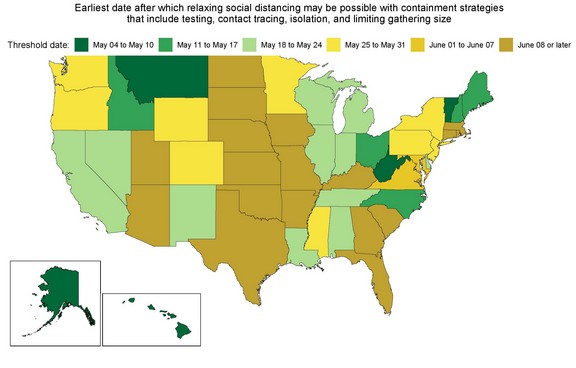
I can not imagine cases ever falling this low. But time will tell.
#38 Also on April 22, 2020, the 500 Bed US Navy hospital left NYC after treating just 179 patients in three weeks.
#39 Also on April 22, 2020 Inslee sent letter to Franklin County that re-opening would be a violation of state law. Inslee stated that the Commissioners were in direct violation his "Stay Home" order. His letter stated, "The action taken by the Board of Commissioners intentionally and knowingly violates an order issued by the Governor pursuant to his emergency powers, see RCW 43.06.220(1), and it therefore violates state law.”
In fact, it is Governor Inslee who is breaking the law because RCW 43.06.220 – along with all other laws by the legislature can not over-ride either the US Constitution or the Washington State Constitution.
#40 On April 23, 2020, NY Governor Cuomo stated that an estimated 14% of all the people in New York likely have the corona virus according to a random antibody test of 3000 people in 19 counties in New York. This should be the final nail in the coffin for Inslee’s plan to get new infections all the way down to zero and monitoring everyone with the virus. Here is a link to the article: https://www.newsday.com/news/health/coronavirus/coronavirus-long-island-new-york-1.44047680
#41 Also on Thursday April 23, the Washington State Employment Security Department admitted that while the official unemployment was 605,514, actual claims could be as high as one million by April 26 – three times higher than the peak of the Great Recession. https://esd.wa.gov/unemployment/help
#42 Also on April 23, 2020, the Walla Walla County sheriff became the third elected sheriff in Washington state to defy the Governors shutdown order. https://komonews.com/news/local/walla-walla-co-sheriff-aims-to-reopen-economy-amid-pandemic
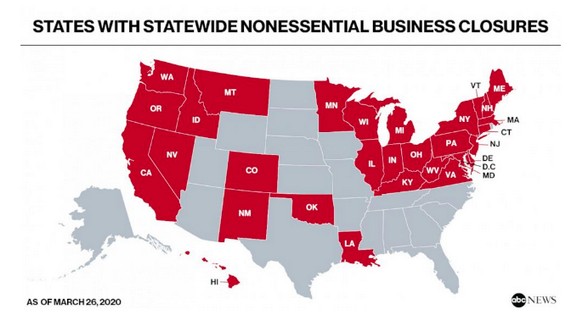
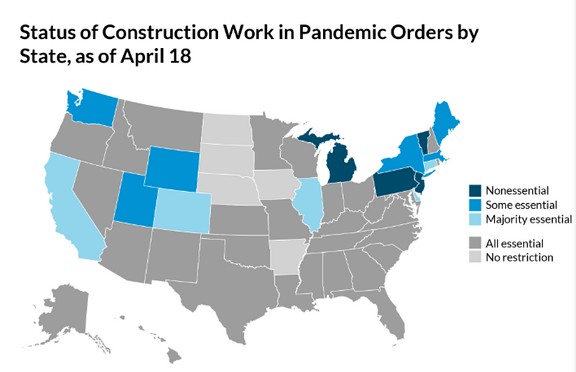
#43 On April 24, 2020, Washington state governor Inslee announced that certain low-risk construction projects - that had already been underway - could restart as long as they can comply with a very strict Corona Virus Safety Plan - which includes requirements for corona training, physical distancing, Personal Protection Equipment, and monitoring employees for symptoms. The announcement does not allow any new construction activity. The problem with the announcement, besides the impracticality of PPE on a construction site is that Washington was one of only 10 states to not declare construction as an essential activity in the first place. All of the states around Washington, including Oregon, Idaho and California have allowed the vast majority of construction projects to continue. Here is a link that shows which states have shut down the majority of construction projects. https://www.urban.org/urban-wire/essential-construction-work-during-pandemic-needs-prioritize-worker-safety
#44 On April 25, 2020, 4 state prison systems, Arkansas, North Carolina, Ohio and Virginia released several studies – all of which confirmed that the ratio of asymptomatic corona virus carriers to carriers with symptoms was about 50 to 1. Marion Correctional Institution houses 2,500 prisoners in north central Ohio. Many of them are older with pre-existing health conditions. 2,300 inmates were tested for the corona virus. Of the 2,028 who tested positive, 95% had no symptoms. The Bledsoe County Correctional Complex in Pikeville, Tennessee tested 3,503 prisoners. 651 were positive, and most of them were asymptomatic. Neuse Correctional Institution in Goldsboro, North Carolina tested all 723 prisoners. Of the 444 who were infected by the virus, 98% were asymptomatic. Dr. Leana Wen, adjunct associate professor of emergency medicine at George Washington University, stated:
“It adds to the understanding that we have a severe under count of cases in the US. The corona virus case count is likely much, much higher than we currently know.”
Here is a link to an article about these studies: https://www.reuters.com/article/us-health-coronavirus-prisons-testing-in/in-four-u-s-state-prisons-nearly-3300-inmates-test-positive-for-coronavirus-96-without-symptoms-idUSKCN2270RX
This adds to the Santa Clara study, the LA study and the New York study all of which support my contention that the corona virus is 50 times more prevalent than currently thought – and therefore 50 times less lethal than currently thought – the same as the seasonal flu.
#45 April 27, 2020 A Facebook group called Reopen Washington has 22,000 members in their first two weeks.
https://www.facebook.com/groups/541022106840124/
#46 Also on April 27, 2020 Governor Inslee held a press conference announcing that come May 5th, we can play golf as long as we only play with one other family member. He also admitted that the state will face a budget shortfall of “billions of dollars.” But he hopes the federal government will bail out the state.
#47 On April 28, 2020, Judge Micheal McHaney, in Illinois issued an injunction against the governor’s Stay Home order. The judge ruled in favor of State Representative Darren Bailey who filed a lawsuit against the governor claiming he would be irreparably harmed if he was forced to comply with the order and that the order violated his civil rights. The judge told the attorney for the governor:
“Are you seriously trying to argue that this executive order has not caused serious injury? The Illinois Constitution is being violated and the Bill of Rights is being shredded. That’s irreparable harm. Individual rights do not disappear during a public health crisis.” Judge Micheal McHaney
#48 Also on April 28, 2020, the New York Times published an article claiming that Corona virus fatalities in the US may be unreported by 50%. To get this result, they carefully cherry picked data from only 7 states. They then carefully selected a five week period that ended April 11 – even though actual data at the time the article was published through April 25. I double checked the data they used and it appeared to be correct. The state of New Jersey was a major outlier – supposedly responsible for most of the under reporting with the claim that it had under reported corona virus fatalities by 3000 deaths in the previous 3 weeks. In fact, through April 11, 2020 corona virus fatalities - as reported by doctors - were only half the excess fatalities in New Jersey. Then the CDC changed the death certificate rules requiring that doctors report all fatalities as corona virus fatalities. Here is what happened the very next week as a result of the rule change: For the week of April 12 through April 18, in New Jersey there were 1421 excess deaths and 1265 reported corona deaths. Therefore in the space of one week, thanks to the rule change, corona deaths went from about half of excess deaths to 89% of excess deaths. So what really happened is not that corona deaths were under reported in the previous weeks. Rather they have been over-reported since the CDC changed the rules. Clearly, the New York Times is not even remotely interested in informing their readers. They appear to only be interested in scaring the hell out of readers in order to sell more papers.
#49 April 30, 2020 Inslee Illegal $11 Billion Budget Blunder Exposed
Imagine you are running a state that is more dependent than any other state in the nation on sales tax from economic activity for revenue. Imagine the annual state budget is $24 billion. Now imagine you decide to shutdown the state economy for 3 months (one quarter of the year) because you were suckered into believing a couple of scam studies funded by the world’s richest billionaire. How much do you think the budget shortfall would be for your reckless decision? Here is a clue. $6 billion is one quarter of $24 billion.
It should therefore not come as a surprise to learn that the budget shortfall in Washington state as a direct result of Governor Inslee shutting down our economy for March, April and May will come to at least $6 billion. Here is a quote from the Center on Budget and Policy Priorities – which issued a report on April 23, 2020 analyzing the budget shortfalls in all 50 states as a result of business closures:
“The Center estimates that state budget shortfalls will ultimately reach about 10 percent in the current fiscal year (which ends on June 30 in most states) and as much as 25 percent in fiscal year 2021 based on recent economic projections.”
https://www.cbpp.org/sites/default/files/atoms/files/4-2-20sfp.pdf
Washington state will get $2 billion in federal aid from the recent corporate bailout bill. This will be almost enough to offset the $2.4 billion budget shortfall for the current fiscal year which ends of June 30th. But it will be up to the state legislature to figure out how to cut a record $6 billion (25%) from the budget for the new fiscal year which begins on July 1, 2020. They will also need to cut the budget for the following year by $2.5 billion.
Even if the legislature cut 20% of the public school teachers, it would only save $3 billion. Cutting 20% from school district budgets means that every class will increase in size from the current 30 students per class (among the highest in the nation) to 36 students per class. 12,000 teachers will lose their jobs along with another 12,000 in administration and support staff.
Cutting 100% of state support for every college and university would save another billion dollars but cost the jobs of thousands of college faculty as well as lead to a possible doubling of tuition at every college and university in Washington state.
That still leaves $2 billion in cuts or more than 20% in cuts from every state agency. That is another 24,000 state public service jobs lost. Total public jobs lost will be as high as 30,000. This does not include the public service jobs lost in cities and counties. They also depend on revenue from sales tax. That is another 30,000 jobs lost.
Then there are the public construction jobs lost due to the 45% decline in the state gas tax. That is another 40,000 jobs. The horrifying total could be as high as 100,000 public sector jobs in Washington state. Every state, county, city, college and school district employee who is about to lose their job because our economy was shut down for three months needs to realize why they were fired. They will not lose their jobs because of a virus that is not much worse than the seasonal flu. They will be losing their jobs because Jay Inslee was fooled into believing some fake science reports paid for by Bill Gates.
How long will social distancing laws be enforced?
The answer to this question varies from state to state. Six states never closed. 15 more states will open by the end of April. 15 more states will open in early May and 10 more will open later in May or early June. Only 6 states have provided no specific end date. Sadly, Washington is one of these 6 states. Here is a table of the timeline:
|
Date Open
|
State Policies as of April 24 2020
|
|
|
Businesses Closed one month or less:
|
|
already open
|
States with no orders continue Arkansas, South Dakota, Nebraska, North Dakota, Utah, Wyoming
|
|
April 24 open
|
Alaska, Florida, Georgia, South Carolina, Texas (partial), Oklahoma,
|
|
April 27 open
|
Colorado, Mississippi, Montana, Tennessee,
|
|
April 30 open
|
Alabama, Arizona, Hawaii, Maine, Texas,
|
|
|
Businesses Closed two months or less:
|
|
May 1 open
|
Idaho, Indiana, Iowa, Louisiana, Ohio, West Virginia,
|
|
May 3 or 4 open
|
Kansas, Massachusetts, Minnesota, Missouri, New Hampshire
|
|
May 8 open
|
North Carolina, Pennsylvania, Rhode Island,
|
|
|
Businesses closed two months or more:
|
|
May 10 to 15 open
|
Maryland, Michigan, New Mexico, New York State , Vermont, Delaware,
|
|
May 20 to 31
|
Illinois, Wisconsin, Connecticut,
|
|
June 10
|
Virginia,
|
|
|
Businesses likely closed 3 months or more.
|
|
Indefinitely
|
6 States with no specific shutdown end date include
California, Kentucky, Nevada, New Jersey, Oregon and Washington
|
The longer the shutdown continues, the more harm it will inflict on small business owners and the more workers that will permanently lost their jobs. So the states at the greatest risk of economic collapse due to the shutdown are California, Oregon and Washington.
#50 On May 1, the Washington state Department of Employment Security announced that over 20 percent of Washington’s 4 million workers have filed for unemployment. Many more will apply in the coming weeks. The number could grow to more than 30 percent – which would be over half of all working age adults in the state.
#51 Also on May 1, 2020, Washington Governor Inslee announced that he was extending the closure of nearly all businesses to at least the end of May. This is despite the fact that the rate of hospital admissions has fallen back to the normal level for nearly one month now. He said in his speech that “The vast majority of Washingtonians do not want to see their relatives die.” Clearly he fails to realize that his shutting down the economy will cause 10 times the number of deaths that the corona virus caused.
The Junk Science Graph Inslee is using to Stop Washington State Businesses Opening
During his press conference on April 27, and again on May 1, 2020 Governor Inslee displayed a graph from the Institute for Data Modeling (IDM) which is funded by Bill Gates. The graph from an May 1 2020 report showed a slight decline in King County Infections through the month of May – but only if Inslee’s extreme social isolation policies are maintained. The report used data through April 20, 2020. At that time, King County had a Transmission rate of R = 0.94. Note that an R value above 1 means that total infections are increasing and R below 1 means that total infections are decreasing.
Here is the graph from May 1:
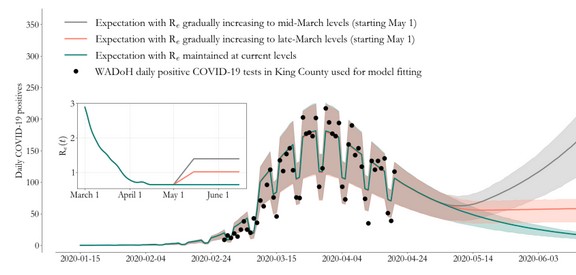
The black dots are the daily corona positive tests reported by the Washington state Department of Health. Currently, there are less 100 daily new cases in Washington state. Beginning May 1, 2020, the solid line splits into three lines. The line that lowers sharply is based on the assumption that corona daily cases decline sharply in May. I believe this is what is going to happen because our immune system has already suppressed the virus. The gradually declining line is assuming we are like Italy and cases will only decline gradually.
The third sharply rising line is what the IDM claims will happen if Inslee allows businesses to re-open. Despite the fact that there is no evidence to support this claim, Inslee believes these IDM con artists and therefore will keep businesses closed to June. The IDM report claimed that Washington state would see “slowly declining rates of daily cases and deaths as is currently being seen in Italy.” This claim ignores the fact that demographics in Washington state are completely different than the demographics in Italy. Italy has the oldest population in the world with a high percent of smokers and very bad air pollution. Washington state has an average age population, below average smokers and very little air pollution. So why does Governor Inslee insist on using Italy for a model?
The only good news is 16 states are opening now. They will prove that removing social isolation does not increase corona virus fatalities. By the end of May, IDM will be exposed for the hucksters they are and Inslee will be forced to re-open our state economy.
#52 May 4, 2020 NY study Proves that Staying Home Does Not Protect You from the Corona Virus
As I have warned for months, there is no way to prevent exposure from the corona virus. This is why we should focus on strengthening our immune system. Instead of staying inside sitting in front of the TV, we should be outside exercising in the sunshine. What the government has been telling you to do is the exact opposite of what will actually protect you.
Data from 100 New York hospitals who surveyed 1000 new patients confirmed that 66% of new corona virus admissions were people who were at locked down in their homes and were following government guidelines to not leave their homes. An additional 18% were locked down in nursing homes and also never went outside.
None of these people were taking public transportation. Most, the majority of whom were elderly, even had someone else do their shopping for them. Very few of them were working. Most were either retired or unemployed. Almost none of these patients were “front-line essential workers.” This is why locking people up never should have happened in the first place. It depresses their immune system.
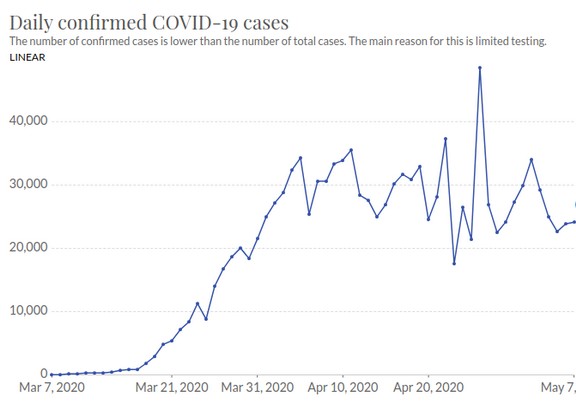
#53 Politicians are Puzzled that New Confirmed Cases Keep Going Up Even Through Hospitals are now Almost Empty
As I have pointed out for months, the number of confirmed cases has nothing to do with actual infections (which are 50 times the number of confirmed cases). Nor do confirmed cases have anything to do with corona virus fatalities – which are more related to actual infections. Instead, confirmed corona virus cases are simply related to the number of people being tested. As more people are tested, then there will be more confirmed cases. The only way to reduce the number of confirmed cases is to reduce the number of people being tested.
This is why it is ridiculous to use new confirmed cases as a standard to prevent counties from opening up. If the county does any testing at all, the county will find new confirmed cases – and will never be able to open up. Yet, shockingly, this is the plan that Governor Inslee is imposing on counties here in Washington state. Very few counties will ever be able to meet this crazy new standard.
Here is a graph of daily new confirmed cases in the US:
Here is a graph of daily tests per 1000 people in the US:
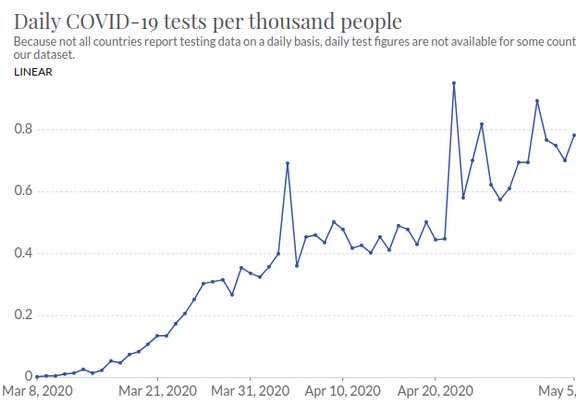
So far, less than one person in a thousand is tested each day.
Will Summer Stop the Corona Virus?
I predict that summer will lead to a significant reduction in corona virus cases and fatalities due to the immune system getting stronger in the summer. The number of daily fatalities should drop dramatically by the end of May. There are many additional reasons to believe that the corona virus will slow down or stop once the sun comes out. For example, here is a quote from one recent study of the corona virus: “In all five selected countries, we found that when there is a significant difference in the daily mean temperature between two regions of a country, a significant difference exists also in the average cumulative daily rate of confirmed cases.” https://www.medrxiv.org/content/10.1101/2020.04.10.20059337v1
The effect of summer is on improving our immune system – in part by the sun increasing our Vitamin D levels and in part by fruits in the summer increasing our Vitamin C levels. Both Vitamin C and D have been shown to have important roles in boosting our immune system – and thereby increasing the odds of our immune system being able to fight off the corona virus.
June 2, 2020: The Day the Bill for Social Isolation Comes Due in Washington state The effect that shutting down nearly all businesses will have on Washington State tax revenue will not be released until 10 am on Tuesday June 2, 2020. It is likely that shortly after this estimate is released, Governor Inslee will have to call a special session of the legislature to cut billions of dollars in programs from the state budget. He will blame the corona virus. But in fact, the billions in cuts will have almost nothing to do with the corona virus. Instead, they will be due to his own incredibly bad decision to shut down all businesses in Washington state.
The people harmed most by extreme social isolation laws will be the one million public school students in Washington state who will be missing their education. Half of these students are so poor that they also rely on the public schools for meals. So a half million children will go hungry. Hundreds of thousands of college students will also see their education harmed. And nearly one million people in Washington state will lose their jobs – increasing poverty and increasing the suicide rate. Currently, 150 people per day commit suicide in the US. How high will the suicide rate rise when 60 million people in the US lose their jobs because of this ineffective social isolation policy? As we have shown earlier, this number might nearly double.
Most of these jobs will not come back when these draconian social isolation restrictions are finally lifted – because many small business owners were already on the edge of bankruptcy. These added restrictions will be the final nail in our economic coffin. Which is why it is important to look at the evidence from objective scientific research on the lack of effectiveness of extreme social isolation policies.
Also on June 4, 2020, I predict that the Washington state legislature will be called into Special Session in order to solve the budget problem that will be announced to the public on June 2, 2020. Inslee and Reykdal have already closed the schools for the rest of the school year. Inslee has also closed nearly all businesses until May 4 2020. I predict that on May 4, 2020, he will announce that businesses must remained closed until June 4, 2020. As noted above, I predict that by June 4, 2020, the number of confirmed new cases will be very low due to the sun coming out and our immune system kicking in. Inslee and Reykdal will use this occasion to declare victory for their social isolation policies.
You can not have a legislative session while the state is in lock down. So June 4 looks like a good day to end the Inslee isolation policies. I also predict that the number of new cases will remain low through September – not because the virus disappeared – but rather because people will have good immune systems. Then the rain will begin in October and the corona virus will come charging back – causing a double bounce or second wave of corona virus fatalities.
October 2020 Get Ready for the Next Wave of Corona Virus School Closures and Business Closures
Corona virus double bounce second wave predictions
On April 1, 2020 , a financial prediction group called Morningstar predicted that there will be a second bounce in November
|
Month
|
Apr
|
May
|
June
|
July
|
Aug
|
Sep
|
Oct
|
Nov
|
Dec
|
|
Fatalities thousands
|
17
|
112
|
52
|
11
|
2
|
1
|
2
|
37
|
39
|
https://www.morningstar.com/articles/976107/coronavirus-update-long-term-economic-impact-forecast-to-be-less-than-2008-recession
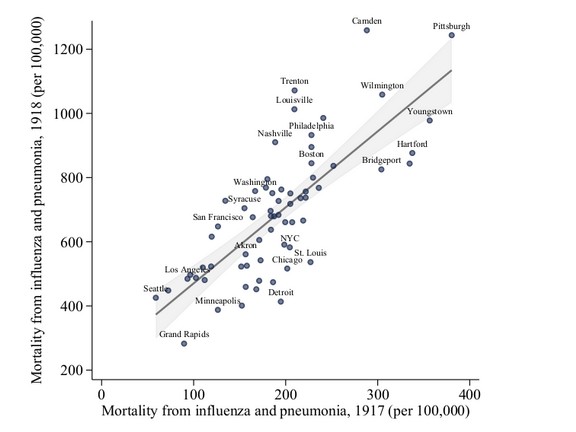
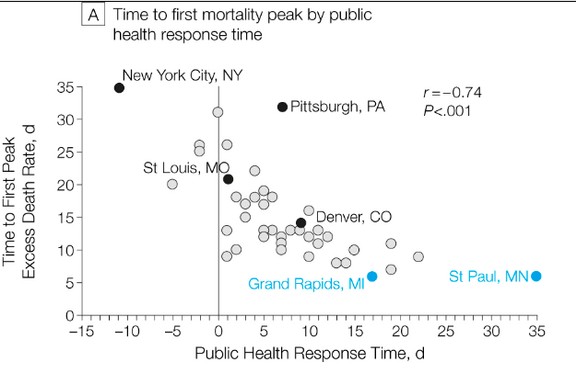
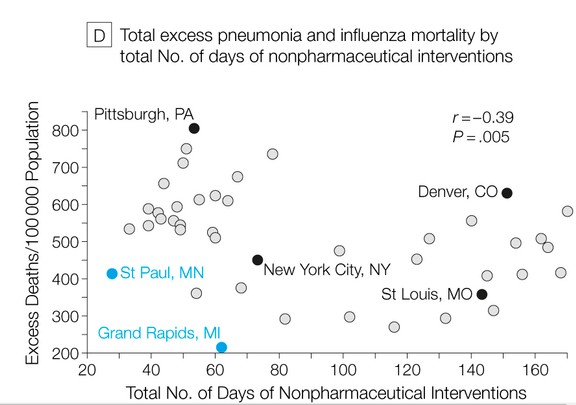
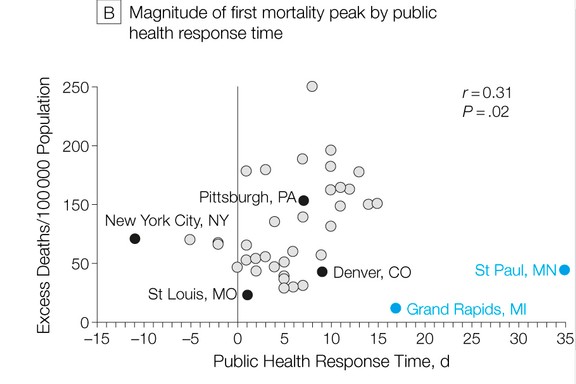
The estimate call for a second wave of fatalities in November 2020 are based on the 1918 Spanish Flu second wave as is shown below:
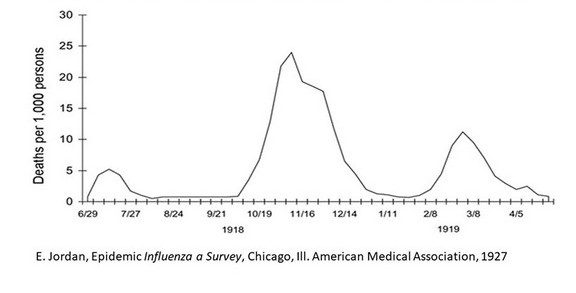
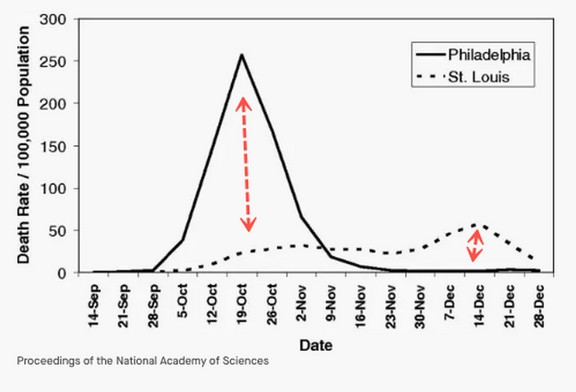
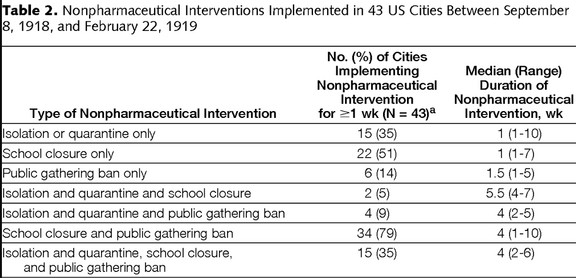
What the above chart of the 1918 Spanish Flu does not show is that the double bounce occurred primarily in cities that practiced social isolation. For example, there was more social isolation in the west coast than the east coast or the Midwest and south. Here is a graph of the second wave in these three regions taken from the complete study of 43 cities:
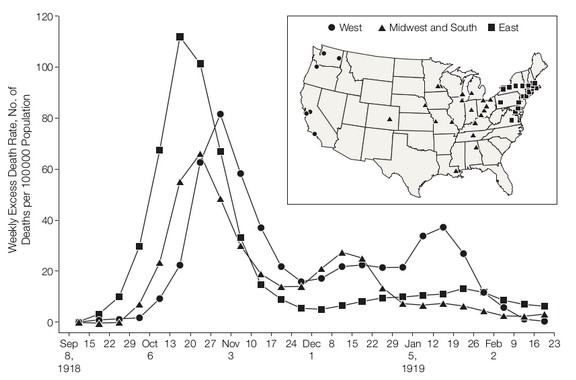
You can see that while the East region had the highest initial fatalities, this region had almost no second wave. Meanwhile, the west coast had the second highest initial fatalities in November 1918. But then thanks to extreme social isolation measures, they had a significant second wave in January 2019.
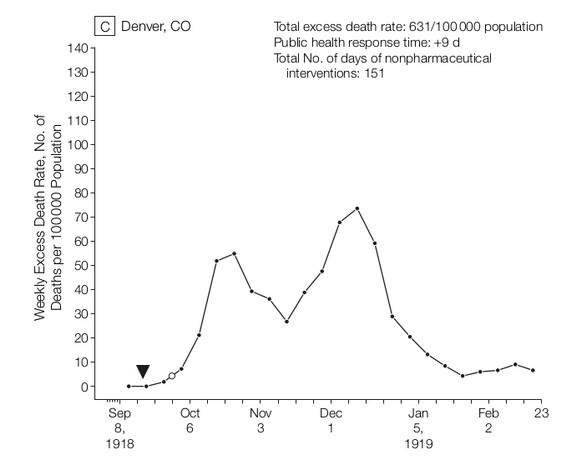
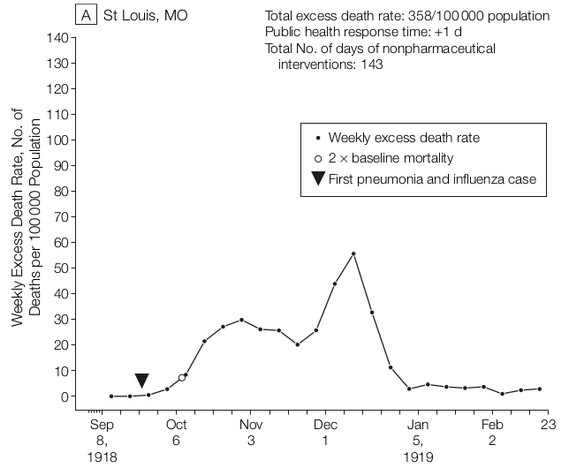
The two cities in the Midwest with the biggest second wave were St. Louis MO and Denver CO. These two cities also had among the highest days of interventions at 143 for St. Louis (which included school closures and a public gathering ban) and 151 for Denver.
Here is the Denver Weekly fatality chart:
Here is the St. Louis Weekly Fatality chart:
I predict that the second wave in the US will occur in October of 2020 and will be much worse than the second wave in 1918. The reason it will be worse is that Washington state and most of the rest of the US have employed draconian social isolation policies that are much more extreme than any policies used anywhere in the US in 1918.
Unless Inslee and Reykdal start seeking out better advice, they will repeat their errors by locking down the Washington state economy again and shutting down the Washington state public schools again.
All this next shutdown will do is further increase fatalities over time by extending the corona virus all the way to next winter – when immune systems are at their weakest. The discredited Ferguson report claims that there will be not just one bounce (like there was in 1918) but a total of 6 additional bounces running all the way through the year 2021. Here is a graph they provide of all of these bounces:
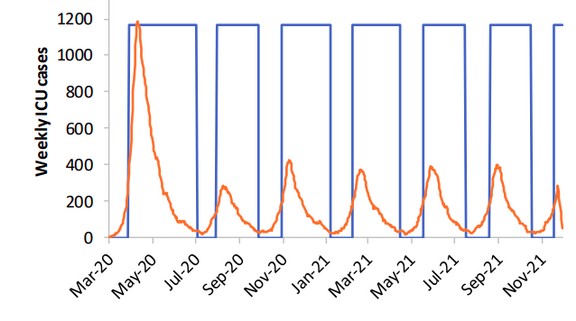
They claim that each time a bounce occurs, social isolation policies will need to be restored to prevent mass death. There is no evidence to support this claim of any virus having 6 bounces. Nevertheless, government officials use this crazy Ferguson 6 bounce model to make the threat that social isolation policies will be needed for the next two years. Thus, the only way we will ever restore anything like a normal economy is to boot these nuts out of office.
What’s Next?
Let’s next compare various states to see how well their extreme social isolation policies have been working.