2.5 Why Our Health Care System was not Overwhelmed

The US military set up emergency hospitals in New York City, Los Angeles and Seattle. None of them were ever used for corona virus patients.

The next ridiculous claim being pushed by the Mass Hysteria Media is that we need draconian social distancing in order to “flatten the curve” so that our health care system does not get overwhelmed. Below is an image from April 10, 2020. Fear over Seattle hospitals being overwhelmed with corona virus cases prompted the US military to build a massive field hospital with 250 beds inside of a convention center just south of Seattle. Here is an image of this hospital:

16

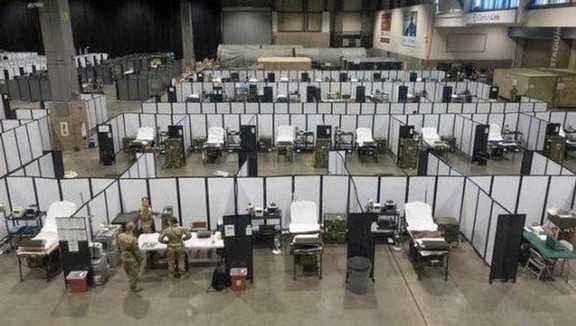
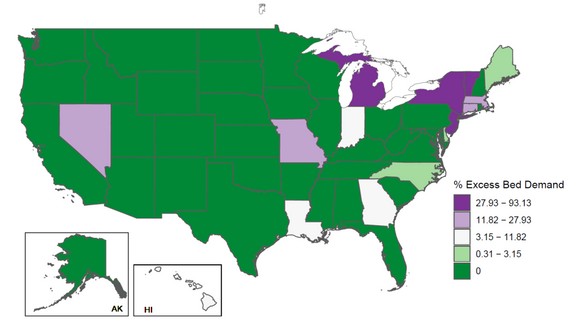
This empty hospital closed after three days without seeing a single patient. The reason it closed was because new cases in Seattle peaked more than a week ago. As I predicted, way back in mid-March, nearly one month ago, local hospitals had no problem handling corona virus cases. In fact, we now know that only 7% of excess beds in hospitals were even used! - 93% empty!

Here is an image of hospital admissions throughout the US in 2020:

17r

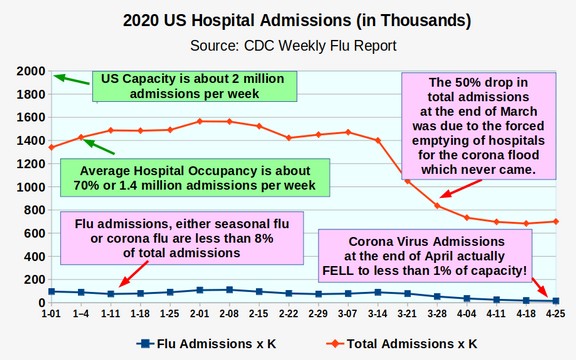
The reason hospital admissions are so important is because they are the most trustworthy and unbiased numbers. The number of Corona Virus “confirmed cases” is simply related to the number of people tested each day. The more people tested, the higher the number gets. Even the number of fatalities is not accurate because we know that hospitals and doctors are strong armed into calling all fatalities corona fatalities. But hospital admissions fly under the radar screen because they are simply a record of how many people check into the hospitals in the US each week – and whether they have flu symptoms. The above chart is therefore one of the most important charts in this entire book, so it is worth looking at it closely.

“Total admissions in thousands” are the red line and “Flu admissions in thousands” are the blue line. The maximum capacity of US hospitals is about 2 million per week. The average number of admissions is about 1.4 million per week (70% of maximum capacity).

Flu admissions, even during winter epidemics, does not exceed 8% of capacity. This is still about 160,000 cases per week. Over a 20 week flu season, this still can be 3 million people – and that is just the people who get such a bad case of the flu, they need to go to the hospital. There are 60 to 100 million other people in the US who get the flu and just stay home and suffer.

Notice that at the end of March, total admissions (the red line) fell 50% - from 1.4 million down to 700,000 admissions per week. This could be the biggest drop in hospital admissions in US history. This huge drop in weekly admissions was due to Stay Home orders around the US that forced hospitals to cancel elective surgeries – even though there was never any chance that the corona virus epidemic would max out capacity. In fact, the corona virus epidemic never even reached the admission rate of the seasonal flu viruses that happened weeks earlier.

The sudden 50% drop in hospital admissions was why hospitals were forced to layoff 50% of the doctors and nurses. The hospital crisis has not been being overwhelmed by the corona virus – but being far below capacity.

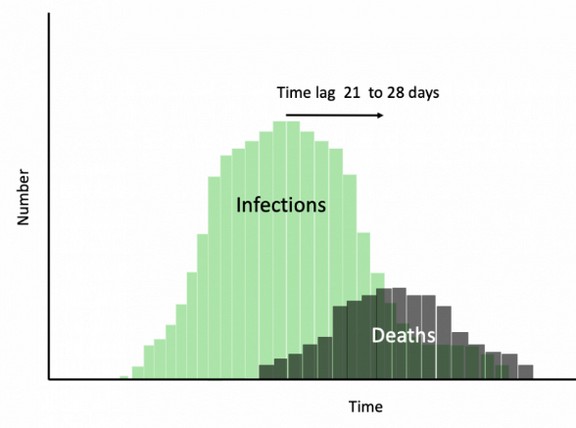
On April 8, 2020, Governor Inslee issued a Press Release attempting to explain why the million dollar military hospital was being dismantled just days after it was built. Instead of stating the obvious – that he had made a huge mistake by greatly over-estimating the risk of the corona virus – he claimed that the reason the giant emergency hospital was no longer needed was because of the success of his social isolation experiment! The reason his claim was ridiculous is because his order had only started 18 days earlier. Even if his order had any effect, it would have taken 10 to 20 days from the time social isolation infections dropped before this drop would be seen in hospital admissions. The truth was the military hospital was never needed.

Inslee also announced that he had returned 400 ventilators that had been given to Washington state by the federal government as these were no longer needed either.

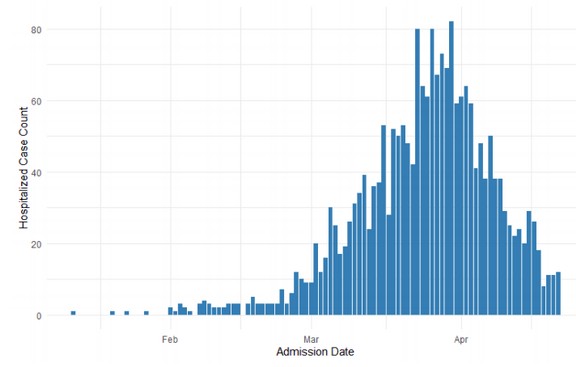
Washington State Department of Health Hospitalization Report
On April 21, 2020, the Washington State Department of Health published a report on hospitalization cases for the corona virus in Washington state. Here is the link to this report: https://www.doh.wa.gov/Portals/1/Documents/1600/coronavirus/covid-hospital-summary.pdf

This report confirmed that Washington State daily admissions never exceeded 80 people and that even this maximum rate occurred in early April and quickly fell back down to less than 40. It is currently less than 10 admissions per day for the entire state and yet the Governor is still keeping the state in a near total business lock down and continues to keep every school and college in the state closed.

18

Given that the average hospital stay for flu pneumonia is about 6 days, this places a maximum load on all hospitals in Washington state of only 480 people – and a current load of only 60 people. https://www.wxyz.com/news/coronavirus/henry-ford-health-853-covid-19-patients-discharged-in-last-30-days

This equates to a national maximum load on all hospitals in the US (outside of NYC) of only 24,000 people. Below is an analysis showing that there was never any risk that hospitals in the US or in Washington state were in any danger of being overwhelmed.

Problems with the Claim that US Hospitals will be Overwhelmed
The first problem with this claim is that extreme social distancing did not flatten the curve in the Spanish Flu pandemic in 1918. It simply extended the curve by a couple of weeks. The second problem with this scare tactic of hospitals being overwhelmed is that it does not take into account the actual number of hospital beds and Intensive Care Units and Respirators and Ventilators in the US health care system. We will now take a look at these numbers to see how ridiculous this claim - that corona virus is about to over-run our health care system – really is. Let’s start with the total hospital beds before we consider the Intensive Care Units.

What is the number of hospital beds in the US?
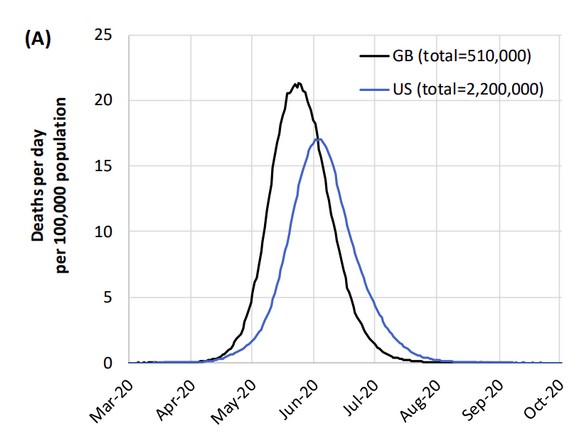
Many fear spreaders in the media like to scare people with the fact that there are only 1,000,000 total beds in American Hospitals despite the fact that we have 330 million people. They point out that there is only one hospital bed for every 330 people. They claim that if the corona virus keeps rising at the current rate, soon all one million hospital beds in America will be full. This might be true if the Ferguson claim of 2.2 million fatalities was accurate. But we have already shown that fatalities in the US could be as low as 99,000. Assume an average mortality rate of 0.1 percent of all cases, this would mean 100 million total cases, I estimate that 0.2% of these cases might require hospitalization (200,000) and that half of these might require Intensive Care Units with Respirators (100,000). These cases will be spread out over a period of at least one month.

But let’s assume for the sake of insanity that all of them showed up at the hospital on the same day. Would such an extreme outcome overwhelm US hospitals? To evaluate this claim, we first need to ask ourselves these important questions:

#1 What percent of corona virus victims require hospitalization? About 20% of diagnosed corona virus cases currently require hospitalization. However, this is because only folks with severe symptoms go to the hospital to get tested and then 20% of these stay in the hospital. As the tests become more widely available, it is likely that the percent that require hospitalization will drop below 1% and may eventually be much less than 1% of actual cases.

#2 How many people are in hospitals with the Corona Virus?
As of April 28, 2020, according to the CDC, there are currently about 1,000,000 cases in the US. https://www.cdc.gov/coronavirus/2019-ncov/cases-updates/cases-in-us.html

10% of 1,000,000 cases is about 100,000 people in US hospitals. However, the illness only lasts 1 to 2 weeks. So to get the current population, we need to divide the above number by 4 – meaning that less than 25,000 people per week are in US hospitals with the Corona virus. This comes to about 500 people per State. (this was confirmed by the April 21, 2020 Washington State report).

#3 What percent of US hospital beds are being used every day?
The shocking part is that 65% of hospital beds are being used on any given day. So while there are about one million beds, only 350,000 hospital beds are empty. The peak rate of 25,000 people was only 7% of the available hospital beds in the US. Currently less than 1 percent of available hospital beds are being used for corona virus patients!

#4 What about the shortage of respirators and ventilators?
The Mass Hysteria Media has claimed that the real problem is a lack of ventilators. This ignores the fact that even of the people hospitalized, only a fraction need a ventilator. Nevertheless, the US leads the world in ventilators at about 100,000. Even assuming that half of these are already being used, there are still 50,000 unused ventilators. It is unlikely that we will need more than 12,000 – even if everyone needing a respirator showed up on the same day! The real maximum number needed is about 5,000 - which is only 5% of the total number of respirators in the US. I am hoping by now you are starting to see how ridiculous all of the claims being made by the Mass Hysteria Media really are.

The situation is a little tighter in King County and Snohomish County Washington where there are about 6000 confirmed cases in the two counties (the highest concentration in the nation outside of NYC). https://www.doh.wa.gov/Emergencies/Coronavirus

King and Snohomish counties offer about 5,000 staffed hospital beds, of which about 1000 are used for critical care. The median hospital in King and Snohomish counties operated at 50% of its licensed capacity. So there are about 2500 hospital beds and 500 Intensive Care Units available (nearly all of which come with respirators) in King and Snohomish counties. https://www.seattletimes.com/seattle-news/health/short-staffed-and-undersupplied-coronavirus-crisis-strains-seattle-areas-capacity-to-deliver-care/

Divide 5000 total cases by 2 and you get 2500 current cases. 20% of these current cases means that 500 people may be in local hospitals and 100 might need respirators in an Intensive Care Unit. In short, less than 20% of the local hospital capacity is being used even at the peak of the epidemic. https://www.wsha.org/for-patients/coronavirus/coronavirus-tracker/

Most of the current cases are at Evergreen Hospital which is in Kirkland just a few miles from the nursing home with all the fatalities. The age of these patients is 80 to 95 years old – all of which have serious previously existing conditions. Evergreen did reach its capacity recently requiring one patient to be taken to Harborview Medical Center – which is one of many hospitals in Seattle.

Despite the fact that local hospitals have plenty of capacity, the federal government has sent Washington state tens of thousands of respirators, gowns, gloves and other protective gear for health care providers. And just in case the tens of thousands of new respirators are not enough, it turns out that the US military has an entire stockpile of 2,000 more ventilators (some reports say up to 20,000 ventilators!

Ventilators Were Actually Killing Some Patients!
We have already provided links to doctors complaining ventilators were actually killing their patients. On April 8, 2020, AP posted an article called “Some doctors moving away from ventilators for virus patents.” https://apnews.com/8ccd325c2be9bf454c2128dcb7bd616d

Here is a quote: “Some hospitals have reported unusually high death rates for corona virus patients on ventilators, and some doctors worry that the machines could be harming certain patients. 40% to 50% of patients with severe respiratory distress die while on ventilators. But 80% or more of corona virus patients placed on the machines in New York City have died. Some health professionals have wondered whether ventilators might actually make matters worse in certain patients. Experts do say ventilators can be damaging to a patient over time, as high-pressure oxygen is forced into the tiny air sacs in a patient’s lungs.”

“Dr. Eddy Fan, an expert on respiratory treatment at Toronto General Hospital stated: “One of the most important findings in the last few decades is that medical ventilation can worsen lung injury — so we have to be careful how we use it.”

The Washington State Hospital Association has posted this request on their website: “The public should understand that most cases of COVID-19 will not mean hospitalization, or even a trip to an emergency room..”

So if you have serious symptoms such as a shortness of breath, then go quickly to the nearest hospital. But if you just have a fever or the common cold, then stay home, wash your hands and drink plenty of liquids. You should be feeling better in just a few days.

What about the shortage of hospital beds in China?
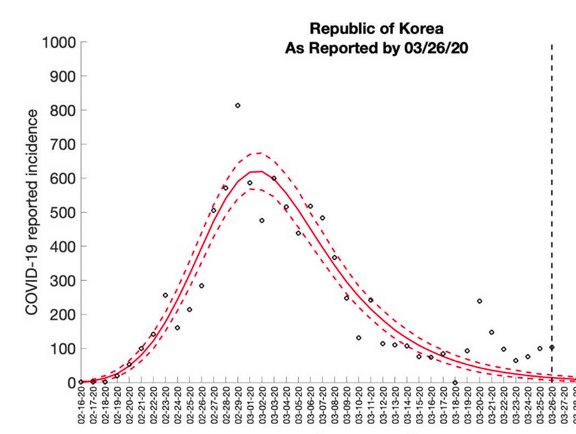
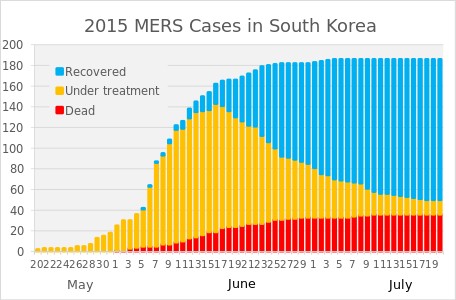
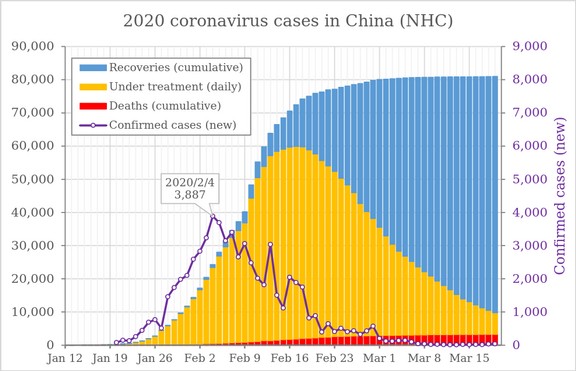
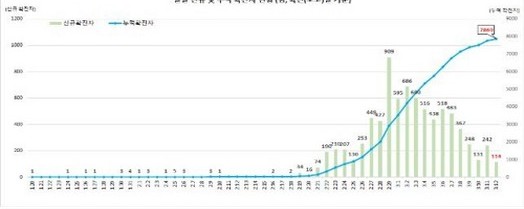
It was reported that the hospital capacity in China was exceeded at the peak of the crisis in China. As we showed in an earlier graph, that peak ran from February 9 to February 23 – a span of nearly two weeks before falling dramatically by the end of February. But even if the peak was exceeded in China, this does not mean the peak will be exceeded in the US. China is a very over-crowded and poor nation compared to the US.

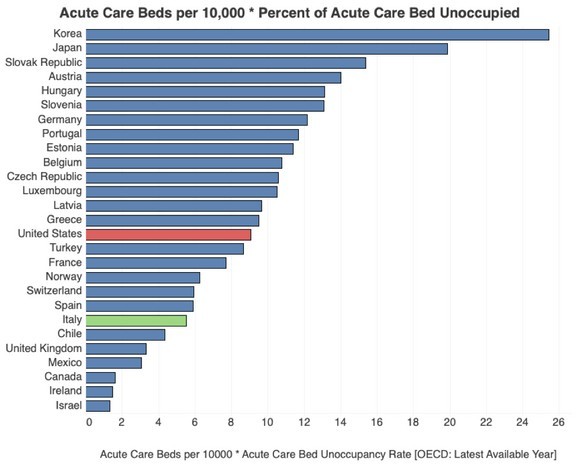
China has so few acute care beds that the rate for China is less than 1 bed per 10,000 people. Put another way, the US has ten times the number of Acute Care beds per 10,000 as does China. So since King County and Snohomish counties has 500 intensive care unit beds, China would have about one tenth this number or 50 intensive care beds. It was the fact that China cannot afford hospitals and Intensive Care Units that was the real problem.

Here is a graph comparing the number of acute care beds per 10,000 in the US versus the rest of the world.

19

Also, it is unlikely that the outbreak in King and Snohomish counties will be anywhere near as bad as the outbreak in China – for the simple reason that the area in China with the outbreak has some of the worst air pollution in the world – and air pollution is one of the leading causes of pneumonia and depressed immune systems.

Also the outbreak in China was a densely populated area with a high concentration of poor people. Poverty is another contributing factor to depressed immune systems and pneumonia. Nearly all of the victims in China did not die from the corona virus – they died from Pneumonia with Corona Virus being a contributing factor.

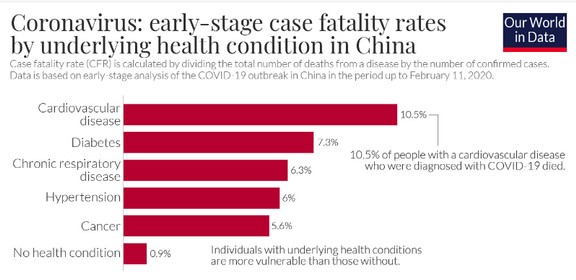
By contrast, King and Snohomish counties have some of the best air conditions in the world. These two counties are among the wealthiest areas in the world – being the world headquarters for Microsoft, Amazon. So it is absurd to be worrying about these two very wealthy counties in Western Washington becoming anything at all like China. Finally, over 99% of the people who died in China had other serious health conditions as is shown by the following chart:

20

What about the shortage of hospital beds in Italy?
The second place being used to scare people is the corona virus epidemic in Italy. There is a very simple reason that the corona virus is much worse in Italy than in the rest of the world. The clue is that the average age of corona virus fatalities in Italy is over 80. This is because Italy has the second oldest population on earth. Over 20 percent of the population in Italy is over 65 years old. This includes 5 million men and 7 million women for a total of 12 million seniors out of a population of 60 million. In the US, the percent of seniors is only 13 percent. In the UK, it is 16.5 percent.

On March 13, 2020, the President of the Italian National Institute of Health answered questions at a Press Conference in Rome. He stated he had completed a study of the medical records of all of the people who had supposedly died from the corona virus in Italy – and he found only two who did not suffer from other serious pre-existing conditions. Over 99% of victims in Italy suffered from serious pre-existing medical conditions with an average age over 80.

“Corona Positive deceased patients have an average age of over 80 years…The majority of these people are carriers of chronic diseases. Only two people were not presently carriers of [other non-COV] diseases…In fact, authorities are unable to distinguish those who died from the virus, from those who were mostly carriers of other serious diseases and who, therefore, would not have died from Covid-19. “

Another factor that led to a shortage of Intensive Care Unit beds in Italy was the initial lack of available Intensive Care Unit beds. As our previous chart showed, Italy has only half the number of Intensive Care Unit beds per 10,000 population as the US does.

A final factor in Italy which may have over-stated the actual number of corona virus fatalities was the way that cases were being diagnosed. Many of the corona virus fatalities in Italy were never actually tested for the corona virus. Instead they died of pneumonia after they were supposedly exposed to someone with the corona virus and they were assigned a category of “presumptive corona virus.”

Italy has only conducted 42,000 actual corona virus tests — out of a population of 60 million. Thus, less than one person in one thousand has actually been tested in Italy. The US has a much lower percent of very old people and a much higher percent of Intensive Care Units. So once again, it is not accurate to be comparing the situation in the US to the situation in Italy – unless of course your goal is just to scare the hell out of people.

21

What’s Next?
Now that you better understand the extent to which the media will go to scare us, in the next chapter, we will review why social isolation is not an effective way to stop the corona virus.


2.4 A More Accurate Estimate of the Time to Peak

The best predictor of future epidemics is past epidemics.
David Spring M. Ed.

As explained earlier, the Ferguson model made a crucial and obvious math error in assuming a time to peak fatalities of 90 days. I noted that the time to peak fatalities in China and South Korea was only 30 days. Based on this time to peak, I estimated that the US should reach peak fatalities on about April 20th (not June 20th as claimed by Ferguson.

However, the reason I chose April 20th as the peak date was to simplify the math. I knew that the peak was about one month when viewed on the large scale of a nation. It was also clear from his graph that Ferguson had chosen 3 months as the time to peak. Thus, it was Ferguson who set the start date for this ticking time bomb as March 20, 2020. I agree that Ferguson was correct about his start date - but he was clearly wrong about his peak date being on June 20.

The truth is that all epidemics are local. They occur in local cities, local counties, local states. National epidemics are simply sums of local epidemics. For example, in the US, the epidemic started about one week earlier in Washington State and New York state than in the rest of the US. Therefore, these two states should reach a peak about one week before the rest of the US. If the US peak will be reached about April 20th, the peak in Washington state and New York state should have occurred about April 13, 2020.

In this section, we will go into more detail about the math of epidemics and what early factors might be used to predict total fatalities.

The first key is to estimate the date when any particular virus reaches a critical mass. This is a threshold at which the virus has achieved a high enough concentration in a given local population to become self-sustaining.

This critical mass threshold can be difficult to determine with a well cloaked virus like the corona virus as most victims exhibit few if any symptoms. Therefore, it is not accurate to try to use numbers of infections because this number cannot be accurately known at the beginning of any epidemic. This is why throughout this book, I ignore the whole debate over the number of infections.

Instead, what can be more accurately known is the number of fatalities. Regardless of the percent of people infected or the total number of people infected, the total number of people reported as being killed by the virus will be a more stable number.

I want to be clear that I do not think that the reported number of people being killed is an accurate number. I am certain that many people who were claimed to have been killed by the corona virus were actually killed by other factors related to problems with their immune system – such as cardiovascular disease.

However, the reported number of people killed by the virus on any given day does not have to be an accurate number. It merely needs to be a stable number over time. I am assuming that the rate of fatality over-reporting remains the same during the entire period of the epidemic.

Examples of Estimating the Date of Critical Mass
A smaller number of fatalities is needed to determine a critical mass in a smaller region, such as a state, than in a larger region, such as the United States. This critical number is an arbitrary number. But it should be a simple number to keep the math simple during the doubling. On a state level, I have used a number of 100 fatalities. My assumption is that local states will begin to take significant voluntary or mandatory isolation actions when the number of local fatalities reaches 100.

But I am also assuming that by the time these actions are taken, the virus will have already spread widely in the community. In other words, that the extreme social isolation actions will be completely ineffective. The eventual reduction of the virus will have nothing to do with the social isolation measures adopted – and everything to do with the natural immune systems of people within the community. We will cover the research on the lack of effectiveness of social isolation measures below in this and other chapters.

The reason I am using State data instead of city or county fatalities is that State data is more available. In Washington state, fatalities exceeded 100 on about March 24, 2020. In New York State, fatalities exceeded 100 on March 22, 2020. Because there is a 10 day delay from infection to fatality, this means that the corona virus reached a critical mass in New York and Washington state on about March 13, 2020. https://www.worldometers.info/coronavirus/country/us/

On a national level, we will use 2000 as the critical mass. US fatalities exceeded 2000 on March 30, 2020. This means that the US as a whole is about one week behind New York and Washington.

New York is an interesting example of what happens when mass hysteria overtakes objective scientific reasoning. The governor of New York, Andrew Cuomo, claimed on March 17, 2020 that peak fatalities would not be reached for 45 days – meaning about May 5th. This estimate was likely based on the reckless and unsupported Ferguson report – meaning that no member of Cuomo’s staff was able to figure out that the Ferguson report was a deeply flawed report. Because there were no rational people on Cuomo’s staff, the entire state of New York has been subjected to a needless and economically devastating shut down. We can only hope that the people of New York remember this insane nonsense at the next election.

Seven days later, on March 24, 2020, Cuomo was forced to dramatically scale back his prior prediction by nearly an entire month. His new claim was that the peak would be reached in 14 to 21 days – meaning about April 7 to 14. He claimed this was based on “new modeling.” In fact, it was simply based on more accurate modeling. The actual data has not changed in the past week.

University of Washington Analysis Matches My Own Analysis
A new model estimating corona virus fatalities was produced by researchers at the University of Washington School of Medicine and released to the public on March 25, 2020. As with the model I have created, these researchers used reported deaths to create their model. However, unlike my model, these researchers assumed that social distancing will have some sort of effect in reducing the rate of fatalities. As I will shown later in this book, this assumption on the effectiveness of social isolation is not correct. But the date of enactment of social isolation policies is nearly identical to the “critical mass” dates I have used – which is my their estimates reached about the same conclusion as my estimates – that a peak will occur in New York and Washington by about the middle of April – not in May or June.

Sadly, the mis-informed researchers at the UW claimed at the beginning of their paper that their prediction was based on “assuming that social distancing measures are maintained.” They then stated that they predict that there will be 81,000 corona virus fatalities in the US in the next four months.

In short, they are advocating for extending the insane social isolation policies for several more months. They also note that there is a high degree of uncertainty in their estimate of 81,000 fatalities. They report a range of as few as 38,000 to as many as 160,000 fatalities. All of these estimates are way less than the 2.2 million predicted by Ferguson just a week or two earlier.

As a saving grace, the researchers also adjusted for the rate and timing of exponential growth of the corona virus in other nations just as I did. Thus, since we have about the same starting date and about the same growth rate, we reached about the same conclusions.

Here is a link to the UW analysis: http://www.healthdata.org/sites/default/files/files/research_articles/2020/covid_paper_MEDRXIV-2020-043752v1-Murray.pdf

The analysis projects New York State will need 48,311 hospital beds on the peak date of April 6. The state will need 7,667 ICU beds and 4,141 invasive ventilators at the peak. As the peak in hospital beds will occur about one week before the peak in fatalities, this means that the UW study estimates that peak fatalities in New York state will occur on about April 13, 2020. Although it is a bit of a coincidence, this is the exact date that I came up with in my calculations done more than a week before the release of the UW report. This does not mean that April 13, 2020 will be the actual peak. The peak could occur a week sooner or a week later than this. But I am confident that a peak did occur well before the end of April.

They also predict that the US peak will occur about one week after the peak in Washington state and New York state. They further state that deaths in the US will drop below 10 deaths per day between May 31 and June 6. My previous calculations also concluded that the epidemic would be mostly over by the end of May. So I am happy that the UW researchers agree.

Sadly, on page 2 of their report, they note that their report was funded by the Gates Foundation – which has been the group pushing the need for extreme social isolation policies. It is no wonder then that this group ignored the research refuting the policies advocated by Bill Gates. I want to make it clear that I have not been bought by the Gates Foundation and I think their manipulation of scientific research has been extremely damaging to the entire world economy.

The world would be far better off using my model which is based on viral critical mass being checked by the human immune system rather than the Gates model of using enactment of social isolation policies to check the spread of the virus.

Page 2 of the UW 25 page report provides some background information on the corona virus. Here is a quote that is relevant to both the method I am advocating and the method they have used to estimate a date to peak fatalities:

“COVID-19 forecasts have largely been based on mathematical models that capture the probability of moving between states from susceptible to infected, and then to a recovered state or death (SIR models). Many SIR models have been published or posted online. 3–20. In general, these models assume random mixing between all individuals in a given population. While results of these models are sensitive to starting assumptions and thus differ between models considerably, they generally suggest that given current estimates of the basic reproductive rate (the number of cases caused by each case in a susceptible population), 25% to 70% of the population will eventually become infected.

The UW report then lists 17 models or studies of corona virus fatalities they looked at (references 3 through 20). We will note and comment on a few of the more important ones here including references 6 and 20 to see where they came up with 80% of the population being infected.

At the bottom of page 2, they reach the same conclusion I reached that the most accurate number to model is daily fatalities: “An alternative strategy is to focus on modeling the empirically observed COVID-19 population death rate curves, which directly reflect both the transmission of the virus and the case-fatality rates in each community. Deaths are likely more accurately reported than cases in settings with limited testing capacity.”

On page 3, they set a minimum critical mass death rate threshold of 0.31 per million. For Washington state, this was less than 3 deaths per 8 million population. I think this is way too low.

They then assumed that US states without social isolation laws will put them in place within the next week. This is not likely to happen as we will explain in our chapter on the drawbacks of social isolation.

At the bottom of page 8 and top of page 9, they list some limiting factors. Surprisingly, they do not list the poor air quality in Wuhan China and Northern Italy, Instead, they blame the high fatality rates on restricting ventilation in the elderly. Certainly, the lack of ventilators in Italy and Wuhan may have increased fatalities.

But they were not the underlying cause of the fatalities as many of the fatalities in hospital were on ventilators and many of the fatalities died at home and never made it to the hospital. So it would not have mattered whether there were more ventilators or not. In any case, the US leads the world in ventilators so this problem will not be as big a factor here as it was in China and Northern Italy.

They conclude their study on page 8 by stating: “Our estimate of 81 thousand deaths in the US over the next 4 months is an alarming number, but this number could be substantially higher if excess demand for health system resources is not addressed and if social distancing policies are not vigorously implemented and enforced across all states.”

The provide no evidence to support this claim. I am sure that Governors across the US will use this report as a further excuse to maintain draconian social isolation policies – and then give themselves a pat on the back once the peak of the fatality curve has passed – despite the fact that the shape of the curve has almost nothing to do with draconian social isolation policies and everything to do with the natural human immune system.

Page 17 has Figure 4 which is their estimated US daily death rate in red with a peak of 2200 on April 15 2020 :

13


On page 20 of the UW report is a surprising graph showing that only a few states would exceed the bed capacity of their hospitals:

14

I have not studied the hospitals in New York. But I did study the hospitals in Washington state and concluded about one week ago that Washington state would not exceed either its beds, Intensive Care Units or ventilators. So I am glad that this study reached a similar conclusion. (Figure 8, not shown, also concluded that Washington state would not have a shortage of Intensive Care Units).

Next let’s look at some of the other models they used to inform their own model:

11. Anastassopoulou, C, at al. Data-based analysis, modeling and forecasting of the COVID-19 outbreak. MedRxiv. March 2020. https://www.medrxiv.org/content/10.1101/2020.02.11.20022186v5.full.pdf

“As the number of infected individuals, especially of those with asymptomatic or mild courses, is suspected to be much higher than the official numbers, we have repeated the calculations under a second scenario that considers twenty times the number of confirmed infected cases, leaving the number of deaths unchanged. “ This was the first study I read that used a ratio of 20 to 1. They did report a doubling time of 6 to 7 days.

14. Georgia State University. Corona virus Incidence Forecasts.
This has several useful graphs showing the timing to peak in several countries. Here is South Korea with minor voluntary showing a start on February 16 and a peak 3 weeks later:

15

15. Carnegie Mellon University. Mathematical model shows heterogeneous approach might be best for reducing COVID-19 deaths. Mellon College of Science. Published March 17, 2020

Here is a quote: “Strategies which focus on minimizing transmission rates to every extent possible in the entire population could increase deaths among all age groups. We found that a heterogeneous approach that focuses efforts on decreasing transmission of the virus among the most at-risk populations, specifically those over 65, would result in the fewest number of deaths.”

What’s Next?
We will next look at evidence that hospitals were not overwhelmed by the corona virus.

2.3 Flaws of the Ferguson UK Report

Ferguson made two glaring mistakes. First, he assumed the corona epidemic would take 3 months to reach a peak when it only takes 1 month. But much worse, he altered data on an earlier report to make it look like social distancing reduced fatalities in the 1918 epidemic – when in fact, it did not.

David Spring M. Ed.


Many fear mongers point to a March 16, 2020 report written by Neil Ferguson with the Imperial College in the UK. Neil predicted that 2.2 million will die from the Corona Virus in the US unless drastic social isolation policies are enacted immediately. Actual fatalities now appear to be under 100,000. Ferguson was off by a factor of 20.

10ar


Ferguson and Imperial College were paid hundreds of millions of dollars to produce this junk science. This was not the first time Ferguson issued a completely inaccurate report. In 2001, Ferguson wrote a fake science report that was responsible for the unneeded death of six million animals during the 2001 Foot and Mouth outbreak. Ferguson claimed that 150,000 people could die. It turned out that only 200 people died. But killing six million farm animals costing the UK billions in farming revenue.

In 2005, Ferguson created panic in the UK during the 2005 Bird Flu outbreak. Ferguson estimated 200 million people could die. The real death toll was only a few hundred.

In 2009, another Ferguson report predicted 65,000 people could die from the Swine Flu outbreak in the UK. Less than 500 people in the UK actually died from the 2009 Swine Flu. https://blog.nomorefakenews.com/2020/04/30/the-british-corona-middle-man/

Thanks to his track record in using fake science reports to promote mass hysteria, Ferguson has been paid millions of dollars by the richest man in the world - Bill Gates. Because the Ferguson 2020 report was used to justify shutting down schools and businesses here in Washington state and because his report was based on flawed data, we will review it. Here is a link to this report: https://www.imperial.ac.uk/media/imperial-college/medicine/sph/ide/gida-fellowships/Imperial-College-COVID19-NPI-modelling-16-03-2020.pdf

Real scientists use actual evidence collected from the real world using transparent methods that can be independently verified by other scientists . Here is an example of real science.

10b

Here are some quotes from this report: “The major challenge of suppression is it will need to be maintained until a vaccine becomes available (potentially 18 months or more) – given that we predict that transmission will quickly rebound if interventions are relaxed.”

“Cities in which these interventions were implemented early in the epidemic were successful at reducing case numbers while the interventions remained in place and experienced lower mortality overall . However, transmission rebounded once controls were lifted.”

The author of the 2020 Imperial College report was Neil Ferguson. The source used for most of the claims made in the Imperial College report was the following 2007 analysis of the social isolation actions of 16 cities taken during the 1918 Spanish Flu epidemic.

Bootsma MCJ, Ferguson NM. The effect of public health measures on the 1918 influenza pandemic in US cities. Proc Natl Acad Sci 2007 https://www.ncbi.nlm.nih.gov/pmc/articles/PMC1849868/

Note that Neil Ferguson was also a co-author of the 2007 study he is now using to justify the claims made in his 2020 report.

As I explain in further detail below, the 2007 Ferguson study was extremely misleading because he “cherry picked” 16 out of 43 cities for which data was available – and the data from the cities he ignored actually refuted the claims he is now making! https://jamanetwork.com/journals/jama/fullarticle/208354

In a few minutes, we will look at how the conclusions get reversed when one considers the entire 43 cities rather than the 16 cities that Ferguson used. After falsely claiming that social isolation worked in 1918, Ferguson then argues that the only two options for the current crisis are suppression and mitigation.

Clue #1: Anytime anyone tells you that you only have two options on any problem, you should know that you are being set up. My experience in 20 years of teaching problem solving is that all problems have at least 10 options!

Ferguson then used a computer simulation to mimic social interactions of children and adults at four locations: households, schools, workplaces and community. He assumes an incubation period of 5 days and a doubling rate of 5 days. His rate of doubling is yet another error. Most scientific research has concluded that the rate of doubling is 6 days – not five days. This matters because over a 30 day period, a rate of doubling of 5 days will lead to twice as many fatalities as a rate of doubling of 6 days! See this link for research on the doubling period: https://www.thelancet.com/journals/lancet/article/PIIS0140-6736(20)30260-9/fulltext

He then assumes schools and businesses are closed for 5 months or longer. This is also ridiculous because in the 16 US cities from 1918 he used to justify his claims, not one of them closed schools and businesses for more than 3 months.

He then concludes that after three months: “81% of the GB and US populations would be infected over the course of the epidemic.” This conclusion is also not supported by any scientific research.

What is the real rate of corona virus infections in the US?
To make even a ballpark estimate of actual infections in the US or UK, we would need to know the ratio of actual infections to confirmed infections. The most recent research on the topic of actual infections to confirmed infections, published on April 14, 2020 is at the following link: https://www.medrxiv.org/content/10.1101/2020.04.14.20062463v1.full.pdf

The above study found that the actual incidents of the corona virus in Santa Clara CS was 50 to 84 times greater than the reported or confirmed incidence. This is why social isolation will never work. For every one person who is confirmed and isolated, there will be at least 49 more who have the virus but are not confirmed and therefore are out in the community spreading the virus to everyone they meet.

This result was supported by another study published on April 18, 2020 of a Boston Homeless Shelter. Here is the link: https://www.boston25news.com/news/cdc-reviewing-stunning-universal-testing-results-boston-homeless-shelter/Z253TFBO6RG4HCUAARBO4YWO64/

Of the 397 homeless people tested, 146 people tested positive. Not a single one had any symptoms. This result supports what I have known all along – that the corona virus – or any other flu virus - is capable of invading an entire population without anyone knowing about it – all due to the huge ratio of people getting the virus and passing it on to others without displaying any symptoms.

The real question, not mentioned in the study was why the percent testing positive was not 100% or all 397 homeless people. I believe the answer is not that they were not exposed – or had practiced social isolation. The real answer is that the people who did not test positive had been exposed to the virus. But their immune systems were strong enough to fight off the virus without them actually getting infected.

A reasonable question is why so many more people are infected in some countries than in others? The problem with this question is that due to the lack of accuracy of the tests, there is really no one of knowing the real percent in each country. What we can know is that each country reached a peak in about 30 days and declined thereafter. Also, no country went over 50%.

Yet despite all of these facts, Ferguson had the audacity to claim an 80% infection rate in the US and UK – with not a single example to support it.

Ferguson then goes on to predict “approximately 510,000 deaths in GB and 2.2 million in the US, not accounting for the potential negative effects of health systems being overwhelmed on mortality.” Here is the Ferguson graph showing how these 2.2 million deaths in the US will occur.

11

As noted earlier, there is a huge and glaring problem with this graph. Ferguson claims the Corona virus will take 3 months to reach a peak. This is completely contrary to what happened in China and South Korea where it took just over one month to reach the peak. This error alone explains how Ferguson was able to come up with such an extremely high number of fatalities. He just kept letting the curve double and double beyond all reason.

Here are the fatalities in the US as of April 22, 2020: 48,000. As we are only days away from the peak, this total is obviously much lower than Ferguson’s estimates of 2,200,000 for the US.

Ferguson also predicts that the demand for Intensive Care Unit beds would be 30 times greater than the available supply in either the UK or the US. We will see shortly that this prediction is also ridiculous.

He also states: “To avoid a rebound in transmission, these policies will need to be maintained until large stocks of vaccine are available to immunize the population – which could be 18 months or more… We therefore conclude that epidemic suppression is the only viable strategy at the current time.”

Ferguson’s claim that we will need to stockpile vast amounts of vaccine and immunize the entire US population against the corona virus before we can return to normal borders on lunacy. Not only do flu vaccines have a very poor track record (as we will review below), but even if a vaccine did work, it would not stop the corona virus because the virus would simply mutate into a new strain. So the entire effort of creating a vaccine would be a complete waste of time and waste of billions of tax payer dollars – not to mention the trillions of dollars lost from shutting down schools and the US economy for the next 18 months.

Yet on March 16, 2020, Washington State Superintendent of Public Instruction went on KIRO radio and announced that was exactly what he intended to do – enforce extreme social isolation policies including converting all schools to an online model for an entire year – until a vaccine was ready and then force the vaccination of the entire population of Washington state before we can return to normal!

It was these insane statements from Chris Reykdal on March 16 2020 that led me to publish this book.

Keep in mind that none of Ferguson’s conclusions are supported by the 43 city analysis that he piggy-backed off of in creating his own 16 city analysis which in turn he used as the basis of his estimates.

What was most shocking about the 2020 Ferguson report is that he did not list the 2007 JAMA 43 city study in the References section of his 2020 report or his 2007 report – even though his cherry picking of data was taken from the 2007 JAMA report. This is extremely dishonest. Yet this deeply flawed report was the report which led to the closure of all schools and businesses in Washington state.

What’s Next?

We will later take a deeper look at the real 2007 JAMA report which reveals a much different story about the lack of effectiveness of extreme social isolation policies. First, we will look at how to better estimate the time to peak. These more accurate estimates show that the time to peak has already been reached.


2.2 Evidence the time to peak is about one month

“In the mid-19th century, Dr. William Farr made the observation that epidemic events rise and fall in a roughly symmetrical pattern that can be approximated by a bell-shaped curve.”
Farr’s Law 1840

Here is a graph using Farr’s Law made by the Center for Evidence Based Medicine estimating the corona virus normal course of progression:

05

While the actual course in each country will be shaped slightly different, this graph is approximately true regardless of social isolation measures used in an attempt to change it.

In keeping with Farr’s Law, in most countries experiencing the corona virus flu, or any other flu epidemic, the number of cases rises for about a month and then hits a peak and begins declining for a month as the population gains resistance to the disease via their natural immune system. The reason I expected this to be the case is because I had studied the 2002 SARS flu epidemic and the 2012 MERS flu epidemic. Here is the pattern in South Korea in the 2015 MERS Flu epidemic:

06

The entire flu season may be 6 months long. But in any given location, the epidemic is only two months long. In most cases, the flu epidemic infects less than 20% of the population because 80% of the population was exposed to a similar flu virus at some point in the recent past and therefore was immune to the new strain of the virus.

Therefore, when the corona virus hit Wuhan province in China I was expecting that it would rise for one month, hit a peak and begin falling for one month. Here is the graph of what actually happened in China.

07

https://en.wikipedia.org/wiki/File:2020_coronavirus_patients_in_China.svg

In Wuhan, a densely populated region of about 10 million people, the daily number of confirmed cases reached a peak of 3,887 on February 4, 2020 and by March 8th had declined to 1,000 cases. The daily fatalities reached a peak 10 days later on February 14, 2020 of 143. The total number of fatalities was about 3,000. https://www.worldometers.info/coronavirus/coronavirus-death-toll/

Because of all the press coverage at the beginning of the media hysteria, back in early February, I began to look into what made the corona virus in Wuhan China more lethal than the seasonal flu.

I quickly discovered the air pollution problem was among the worst in the world. I also discovered that the fatalities were mainly in older men and that in China more than 50% of men smoked cigarettes. China has one of the highest rate of cigarette smokers in the entire world. The men in this single country consumes 30% of the world’s cigarettes. https://en.wikipedia.org/wiki/List_of_countries_by_cigarette_consumption_per_capita

Over 99% of the corona virus fatalities in China involved people with pre-existing conditions like cardiovascular disease and lung damage from all of the cigarette smoking.

It was obvious to me that the corona virus was taking advantage of damaged lungs and depressed immune systems. There were only 300 fatalities among people with normal healthy immune systems which came to only 30 people per million population. This was actually LESS than what is expected each winter from the seasonal flu. So I could not understand the media hysteria. Why weren’t they reporting the real cause of the fatalities in Wuhan?

Here is the 2020 South Korea Corona Virus Active Cases chart (again, same 30 day pattern):

08

http://www.koreapost.com/news/articleView.html?idxno=20457

Note that South Korea did not engage in mandatory social isolation to the same extent as China. In South Korea, isolation was voluntary. While the time period was the same, the number of fatalities per million population was less in South Korea than in China.

South Korea had 158 deaths in a population of 51 million. This was a rate of only 3 per million. This lower death rate was in part due to the massive testing program in South Korea. But it was also likely due to less air pollution in South Korea. Beginning on March 15, 2020, South Korean Corona Virus Recoveries outnumbered new Infections for four days in a row. The steepest part of the active cases curve occurred on February 29, 2020 when 909 new cases were confirmed in a single day. The daily rate then began to fall to less than 100 new cases per day until March 15.

So in both China and Korea, we can estimate that from the beginning to the peak is just over one month followed by a one month gradual decline. Despite using two completely different containment methods, one mandatory and the other voluntary, both countries had about the same results in terms of the length of the epidemic.

South Korea did do an incredible job in offering free voluntary testing to their citizens - including about 50 drive-through testing stations across the country, where it took only 10 minutes to go through the whole procedure. Test results were available within hours.

South Korea processed up to 15,000 diagnostic tests a day, and the total number of tests reached over 220,000. The entire containment effort was voluntary. South Korea’s Vice Health Minister Kim Gang-lip told journalists: “Without harming the principle of a transparent and open society, we recommend a response system that blends voluntary public participation with creative applications of advanced technology.”

This is why I was confident as far back as February that, if there was an epidemic in the United States, it would peak about 30 days past the start of the “critical mass” date and then end about 30 days after the peak date.

This was also why I was confident that this pattern would be followed regardless of whether social isolation policies in the US were mandatory or voluntary. Not only is the time to peak similar in China and South Korea, but both of those curves are similar to the curve for the seasonal flu. Here is the seasonal flu chart in the US for the winter of 2019 to 2020:

09

Each bar represents one week. https://www.cdc.gov/flu/weekly/index.htm#ILIMap

Type B Flu started in December, peaked at the beginning of February and was over by March. Type A flu started in January, peaked at the beginning of March and was over by April. This is what most flu epidemics look like. Here in the US, confirmed cases of the corona virus began in early March. But a critical mass of cases did not happen until about the middle of March in Washington state and New York.

This means that the peak will happen in Washington state and New York in about the middle of April. The rest of the US is about one week behind.

As of May 8, 2020, less than 2000 people per day are claimed to be dying from the corona virus in the US. We are now well past the peak of daily fatalities which means that our current 80,000 claimed deaths will turn into about 90,000 claimed deaths by May 13. Assuming that fatalities tapper off in the next 30 days, it is likely that the total number of claimed deaths in the US will be less than 120,000 by the end of May and the total number of actual deaths will be less than 60,000.

Start date

Total US
Claimed Fatalities

Total US Actual Fatalities

5 day period additional claimed fatalities

May 8

80,000

40,000

10000

May 13

90,000

45,000

8000

May 18

98,000

49,000

8000

May 23

106,000

53,000

6000

May 28

112,000

56,000

4000

May 31

116,000

58,000

2000

About 8,000 people die every day in the United States. Thus, even at the height of this epidemic, the number of corona virus victims is still a small fraction of all US fatalities.

Since March 18, the CDC has issued daily and weekly reports confirming that the number of US hospital admissions for the corona virus has been declining dramatically.

Here is the chart.

10

During the fourth week of April, hospital admissions for flu like illnesses fell back to the normal baseline for the past several years.

It is therefore nearly certain that in the next 30 days, fatalities in the US will also fall back to the baseline. By the end of May, there will be almost no corona virus fatalities – regardless of whether social isolation policies are maintained or abandoned.

Here is the link to the CDC weekly flu report: https://www.cdc.gov/flu/weekly/index.htm

What’s Next?
We will next look at the flaws in the Ferguson UK report. This is important because the Ferguson report was used to shut down businesses all over the world.

2.1 Structure of the Seasonal Flu and Corona Virus

The corona virus is a toxic mix of four different flu families that magically came together to form a virus that had never existed before.

David Spring M. Ed.


There is a debate about whether we are allowed to describe the corona virus as simply another version of the flu or whether the corona virus is completely different from the flu. On a technical level, the corona virus is slightly different from the seasonal flu. But on a practical level, there are only a few important differences between these two viruses. In this chapter, we will look at the differences and similarities between the corona virus and the seasonal flu virus that most of us are already very familiar with.

01


Why Some Corona Virus Cases are Worse than Others… Corona Virus Spikes and ACE 2 Receptors
The above drawings are just artistic renditions of the seasonal flu and Corona virus. We will look at actual electron microscope images in a moment. The above drawings show the major structural difference which is that the seasonal flu has rounded spikes on the outside of the virus shell. These rounded spikes of the seasonal flu virus are not very good at attaching to human cells and makes it easier for our immune system to fight off the seasonal flu.

By contrast, the Corona virus has club like spikes on the outside of the virus shell. These club like spikes make it easier for the Corona viruses to attach themselves to ACE-2 receptors which are on the surface of many human cells. But the good news is that the corona virus can only attach to “weakened” cells.

02

As the dead human cells build up, they can gather in our lungs. If enough of these dead cells build up, they fill up our lungs and make it difficult to breathe. This is known as viral pneumonia.

A few victims eventually suffocate to death – even when the victims are in hospitals with respirators! Thankfully, things only get this bad with extremely old patients who also suffer from cardiovascular disease and/or other risk factors. Even then, only a small percent are affected. In victims without cardiovascular disease, the chance of death is much less than one percent – and may be even lower than the seasonal flu (about one in one thousand). The reason we are highly likely to survive a corona virus infection is our remarkable immune system is able to find a way to identify and kill off all the Corona viruses before they can kill us off.

Given that the seasonal flu, the SARS virus and the MERS virus or any other virus in thousands of years is not as good as the Corona virus in attaching themselves to ACE 2 receptors, an important question we need to examine is:

What exactly are ACE 2 receptors and why are they weaker and less able to stop the corona virus in older people?
ACE 2 receptors have many functions. One of those functions is to respond to cardiovascular disease (CVD) – which is the underlying cause of most of the leading causes of death – including heart attacks, strokes and high blood pressure. ACE stands for Angiotensin Converting Enzyme. The 2 at the end means that this enzyme counter-acts the effect of an enzyme which is simply called ACE. As with many other systems in the human body, our immune system is extremely complex and involves all kinds of complex molecules that balance each other out. In fact, there are nearly an infinite number of possible organic chemical reactions.

The bottom line is that people with Cardio Vascular Disease have cells with weakened ACE 2 receptors. If we are to reduce the number of fatalities from the Corona virus, the best way to do this to reduce cardiovascular disease which in turn will strengthen our immune system and help ACE 2 receptors fight off corona viruses. Therefore, the key to understanding how to protect in the long run against the Corona virus is to have a better understanding of how to reduce Cardio Vascular Disease. We will explain how to reduce cardiovascular disease later in our section on Prevention. But what increases the risk of Cardio vascular Disease and therefore death from the Corona virus is sitting on the couch all day getting stressed out listening to the talking heads on TV explaining why you can not leave your house! In short, the “Stay Home” order being promoted on TV is certain to increase fatalities rather than reduce them!

Now that we better understand the interaction between the corona virus, ACE 2 receptors and our immune system, we need to ask: How did the Corona Virus develop this remarkable ability to attack human ACE 2 receptors?
First, it must be noted that the closest cousin to the Corona Virus, the 2002 SARS virus was pretty well designed for attacking the ACE 2 receptor. But just not as good as this new 2019 version. We have already noted that the flu virus and corona virus mutate rapidly – with 100 mutations per year. So some might argue that this new and better version of SARS was bound to happen someday. But the rapid rate of mutation raises more questions than it answers. The main question is that if this ability to attack ACE 2 receptors this well was really a possible mutation of the virus in nature, then why did this particular mutation not show up until 2019? Why didn’t it show up a thousand years ago? We have new flu virus outbreaks every 10 years and have new serious flu outbreaks every 100 years.

This has been going on for thousands of years. So one wonders why this scary mutation shows up now and not earlier. Just consider the math. 100 mutations every year is 10,000 mutations every hundred years and 100,000 mutations every century. Now suddenly, after hundreds of thousands of mutations, the virus finally figures out how to attack one of the human immune system’s most important functions? It seems hard to believe we can be that unlucky - or put the other way, that the corona virus could be that lucky.

There are many other strange and unique aspects of the 2019 Corona virus that are equally hard to understand. One is the rate of people who get the corona virus without symptoms. It is almost certainly at least 50% and may be as high as 90%. Below are some links and quotes:

March 2020 Clinical characteristics of 24 asymptomatic infections with COVID-19 screened among close contacts in Nanjing, China. https://www.ncbi.nlm.nih.gov/pubmed?term=32146694

“None of the 24 asymptomatic cases presented any obvious symptoms while screening.  7 (29.2%) cases showed normal CT chest images and had no symptoms during hospitalization.  The median communicable period, defined as the interval from the first day of positive tests to the first day of continuous negative tests, was 9.5 days (up to 21 days among the 24 asymptomatic cases). 

“In a COVID-19 outbreak on a cruise ship where nearly all passengers and staff were screened for SARS-CoV-2, approximately 17 percent of the population on board tested positive; about half of the 619 confirmed COVID-19 cases were asymptomatic at the time of diagnosis. A total 318 (51%) of all confirmed cases were asymptomatic.”

Study from China: “By our most conservative estimate, at least 59% of the infected individuals were out and about, without being tested and potentially infecting others,” says Wu Tangchun, a public-health expert at Huazhong University in Wuhan, who led the study. “This may explain why the virus spread so quickly in Hubei and is now circulating around the world.”

By contrast, the seasonal flu has about 20 percent of asymptomatic cases: https://www.ncbi.nlm.nih.gov/pmc/articles/PMC4586318/

Even with people who have symptoms, the symptoms often do not show up for several days. These two problems greatly increase the ability of the virus to travel undetected from victim to victim. By contrast, the seasonal flu is most contagious in the three to four days after symptoms begin. https://www.cdc.gov/flu/about/disease/spread.htm

The 5% who require hospitalization is also much more than the seasonal flu (which is only 1 to 2 percent). Also, these severe cases stay in hospital twice as long (11 to 14 days versus 5 to 6 days).

Finally, the percent of people to get the corona virus is estimated to be more than the flu. Each year 15% to 20% of people get the flu, but estimates of people getting the corona virus this year range from 24% to 50%. However, there was no evidence given to support such a high infection percentage other than the Princess Cruise ship infection rate. https://www.nature.com/articles/s41591-020-0822-7

So how can a virus evolve or mutate to have these hidden infection characteristics – when for thousands of years, it has had much different characteristics?


What about the bat virus?
The primary narrative in the corporate media is that the corona virus resulted from someone in China eating a bat. I have read the research on the genetic correlation and I find this difficult to believe. How can a virus evolve in a bat to be able to so precisely target the human immune system? Here is one study of ACE2 receptors in Bats https://www.ncbi.nlm.nih.gov/pubmed/20567988

While there was some minor activation, the SARS virus did not do very well with these bats. Another 2013 study stated: “To date, no SL-CoVs have been isolated from bats, and no wild-type SL-CoV of bat origin has been shown to use ACE2.”

The study then found some bat SARS viruses that had a 95% match to the human SARS virus. This Bat SARS virus was able to invade human ACE 2 cells but did not replicate very efficiently once inside. Also, a 95% match means that a lot of mutation would be needed to go from the Bat SARS to the 2019 Corona virus. I am therefore skeptical of the Bat to human theory -as are many other people.

Part of the problem in determining the original of the Corona virus is the complexity of viruses in general. It is not like there are just a few common viruses. Instead, due to massive mutation over time, there are millions of different types of viruses. Because they are so small, it is very difficult to study these viruses. This next study used a short-cut method trying to determine the human ACE2 activity of hundreds of related SARS viruses. https://www.biorxiv.org/content/10.1101/2020.01.22.915660v1.full

The 2019 Corona virus and the 2002 SARS virus are part of a family of viruses called Beta Corona Viruses. The Beta Co-V family is further divided into four lineages. We as humans are mainly interested in studying lineage B, which includes the 2002 SARS virus and the 2019 Corona Virus. But lineage B also has 200 other family members. We are also interested in lineage C, which includes the 2012 MERS virus. Lineage C has over 500 family members. So the 2019 Corona virus lives in a family with 200 closely related brothers and sisters - and it also has 500 other “close cousins” and all of them are mutating at a rate of 100 mutations per year. And these mutations have been going on for thousands of years.

All 700 of these related viruses have receptor binding domains (RBD) that potentially play a crucial role in binding to human ACE2 receptors.

What is a Receptor Binding Domain (RBD)?
A Receptor Binding Domain is a specific protein molecule at the end of a virus spike. This Receptor Binding Protein works as a key to open the lock into the target cell as is shown on the following figure:

03

The following studies look at how the corona virus RBD was mutated to give it the ability to unlock human ACE2 receptors.

This study found that the 2019-Corona virus RBD was capable of entering cells expressing human ACE2, but not any of the other receptors of other animals tested. In plain English, the Corona virus comes with a key made to unlock human and only human ACE2 cells – it seemed to be designed for the human ACE 2 cells.

Even more interesting, their study showed that the 200 lineage B virus families could be divided into three distinct clades or clans.

Note: Clades are a biological family term similar to the human “clan” family term. It means a group of closely related viruses.

The 2002 SARS 1 virus was definitely and exclusively in Clan 1. Clan 1 viruses and only Clan 1 viruses with Clan 1 RBD were capable of entering ACE2 cells. But surprisingly, just having the RBD from Clan 1 was not sufficient to facilitate entry into the ACE 2 cells.

Instead, the study found that Corona virus entry is a multi-step process involving multiple, distinct domains in spike that mediate virus attachment to the cell surface, receptor engagement, protease processing and membrane fusion.” In short, there are several factors needed to make the 2019 Corona virus work.

“Our results show that, despite all (700 types of Beta Corona viruses) being classified as the same virus species, most lineage viruses do not use currently known corona virus receptors.”

“The RBD for 2019-nCoV has residues and motifs found in all 3 clades but forms a distinct clade, so we tested it for receptor usage and observed entry only with human ACE2 - but not other known corona virus receptors.”

“Interestingly, the 2019-Corona virus RBD forms a clade that is distinct from the other 3 clades. However, the 2019- Corona virus RBD contains most of the contact points with human ACE2 that are found in clade 1 as well as some amino acid variations that are unique to clade 2 and 3. Taken together with our receptor assay results, it may be possible that 2019-Corona virus arose from recombination between clade 1 and the other clades. “

Please read the previous two sentences slowly three times. Then think to yourself: How could that even be possible? How can a clan 1 virus recombine itself with precise sections of clan 2 and clan 3 such that the resulting RBD is a perfect match for human ACE 2 receptors – and have all of this mutation occurring inside of bats???

Their study showed beyond any reasonable doubt that the Corona virus is not only perfectly designed for the ACE2 receptors, including all of the essential features of the 2002 SARS virus (Clan 1).

But in addition, it has some of the features of the Clan 2 family (aka the 2012 MERS virus) and it has some of the features of the Clan 3 viruses – which are not well covered in the literature because they are not considered relevant to humans.

“2019- Corona virus RBD contains most of the contact points with human ACE2 that are found in clade 1 as well as some amino acid variations that are unique to clade 2 and 3.”

How is this possible? Let’s look at another study to see if we can find some more clues that might have been left at the scene of the crime. Here is a study published on February 16 2020: http://virological.org/t/the-proximal-origin-of-sars-cov-2/398

The Proximal Origin of SARS-CoV-2
“SARS-CoV-2 appears to be optimized for binding to the human ACE2 receptor… The receptor binding domain (RBD) in the spike protein of SARS-CoV and SARS-related corona viruses is the most variable part of the virus genome…. Five of these six residues are mutated in SARS-CoV-2 compared to its most closely related virus, RaTG13… Thus the SARS-CoV-2 spike appears to be the result of selection on human or human-like ACE2.”

The author then notes that the 2019 Corona virus has a poly-base cleavage site. This description is followed by this quote:

“A polybasic cleavage site has not previously been observed in related lineage B beta corona viruses and is a unique feature of the 2019 Corona virus.” Later the author explains that this function enhances cell fusion. Put in plain English, the 2019 Corona virus is breaking new ground in several structural areas.

#1: The corona virus spans clans and lineages: It is not only a mixture of at least three different Beta clans. It also has characteristics previously reserved for Lineage A viruses that aids them in fusing to the victim cell.

#2: The corona virus is the first and only virus of its kind to acquire polybasic cleavage. Here is another quote from the study: “Acquisition of a polybasic cleavage site converts low pathogenicity viruses into highly pathogenic forms” In plain English, this unusual feature adds to the deadliness of the virus. So how can that happen? How can a virus not only mutate out of its clan – but also mutate out of its lineage. It is basically a magic mix that managed to grab all of the advantages of lineage B and combine them with all the advantages from several other families. And throw everything into the same virus at the same time.

#3: The corona virus is ideally shaped to attack weakened human immune system ACE 2 receptors.

#4 The corona virus has a unique ability to hide inside of victims and transmit itself from victim to victim without the transmitting host showing any visible symptoms.

These four very unusual properties have led some to claim that the 2019 Corona virus was genetically engineered. I have been unable to find any information to positively confirm or refute this claim. We need more and better proof that this before we can reach a conclusion one way or the other. We will return to these unusual issues of the corona virus when we discuss vaccines.

Variation in the Seasonal Flu and Corona Virus Over Time
Variations of the seasonal flu virus have been around and interacting with the human immune system for at least three thousand years. Each winter, one of more variations of the flu virus cause massive numbers of fatalities. All flu viruses undergo frequent genetic variation through mutations in order to evade our body’s immune system antibody responses. Seasonal flu viruses mutate about 8 times per month or 100 times per year. This is because they are under pressure not only from our body’s natural immune system but also because each year a new flu vaccine is developed to deal with the previous year’s viral mutations. Each year becomes a game of cat and mouse to see which flu viruses will be able to survive the adjustments of our body’s immune system and the annual changes in flu vaccines. Rapid mutation of viruses are the primary reason that flu vaccines are only effective about 40% of the time – even less in people over the age of 65.

Here is a chart of the effectiveness of flu vaccines over the past four years:

04

https://en.wikipedia.org/wiki/Influenza_vaccine

The average is about 35% effective for all age groups but much less effective for those over age 65. This rate of effectiveness is not much different than the rate of effectiveness of our body’s own immune system. This is one of several reasons that holding out hope for a magic bullet “vaccine” that will end the corona virus problem in a year is so ridiculous. We have been trying to stop flu viruses for 50 years and have gotten no where. If anything it will be harder to create a vaccine for the corona virus than it has been for the seasonal flu.

Three Reasons all Viral Genes Mutate Extremely Rapidly
There are three main reasons all viruses change so rapidly – and in fact are capable of changing as much as is needed. First, the populations of viruses are extremely large – on the order of millions to billions in any given epidemic. Second, all viruses replicate extremely rapidly. There can be hundreds of generations of viruses in a single epidemic. Third, as we have already mentioned all viruses have extremely high mutation rates. Every mutation, which helps the virus to evade the host immune system, or helps the virus evade a vaccine, will be positively selected, passed on to the next generation, and distributed the mutation more widely. So the idea that some magic vaccine is going to permanently fool the corona virus is simply not very honest.

Once the human immune system starts to figure out how to fight back against the corona virus – a change that has already occurred in many people who now have immunity and will occur in many more people in the coming months – then the corona virus will have more of an incentive to evolve and it will likely adopt about the same rate of mutation as the seasonal flu.

It will then mutate even more rapidly once it faces the challenge of whatever billion dollar vaccine we throw up against it. There is almost no doubt that within a matter of days, it will mutate enough to evade the vaccine – and there goes a billion dollars – and once again we will be faced with mass isolation “to protect the ones we love.”

A better alternative is to strengthen our own immune system – as each person’s immune system may develop a slightly different way of fighting the corona virus. The immune system is a free bottom up solution to the corona virus problem whereas the vaccine method is an expensive and ineffective way of pretending to deal with the corona virus. But vaccines are really just supporting drug companies. This extremely rapid rate of mutation viruses is never mentioned in the corporate media because they do not want you to know that a reliable permanent vaccine is simply not possible. Even if a temporary vaccine could be found, the Corona virus would simply mutate into a different form and we would be back to square one.

What’s Next?
Now that we have some understanding of the structural challenges of the corona virus, in the next section we will see how it is similar to and different from the seasonal flu.